Vector Plot
Grapher Template by Golden Software
146
515
Vector Plot
(Template by Golden Software).grt
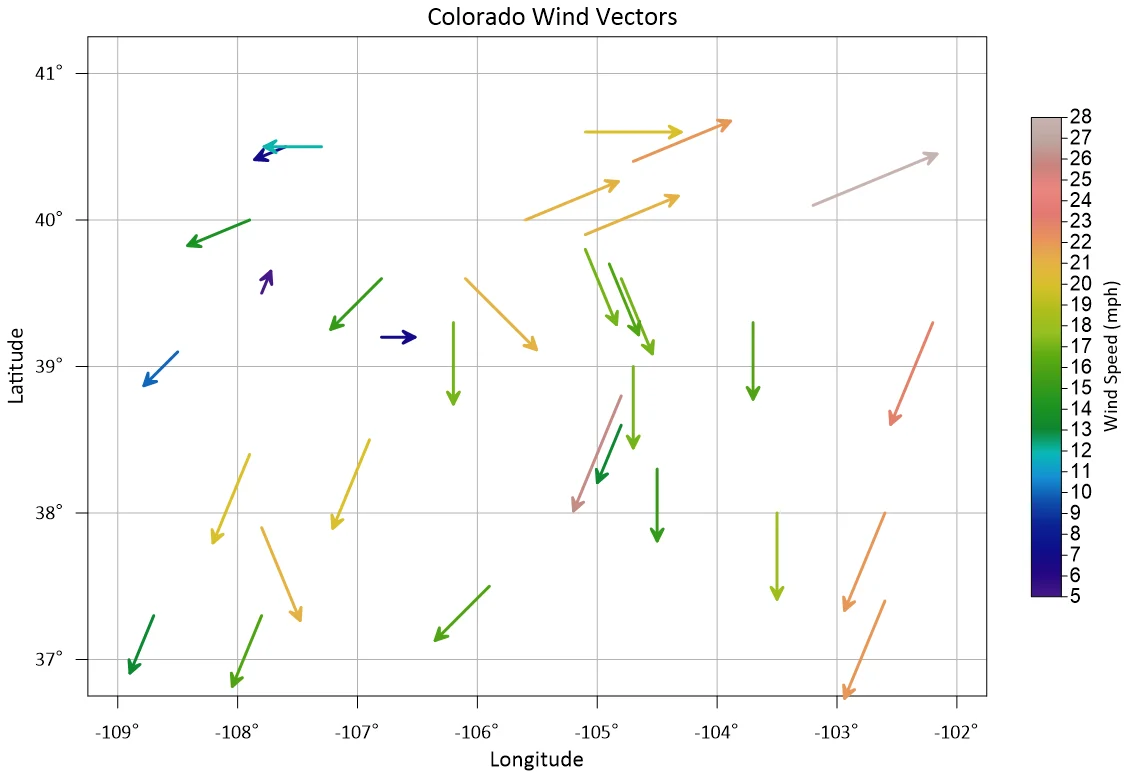
A Vector Plot displaying directional data using arrows positioned on a spatial grid. This plot type is used to represent flow fields, wind patterns, ocean currents, force distributions, and other directional trends in scientific and engineering data. The length and color of the arrows indicate magnitude, while their angle indicates direction. Often used in meteorology, geophysics, and environmental modeling, this plot is ideal for visualizing movement patterns and intensity changes over a defined geographic or structured grid.
The data for this template can be found below which you can download and adjust using your own data:
Industry Focus: Aerospace, Aviation, Climate Science, Earth Science, Ecology, Engineering, Environmental Science, Geophysics, Infrastructure, Marine Science, Meteorology, Oceanography
Graph Features: Vector
Instructions
To use this template in Grapher:
- For the best experience, structure your data in the same format shown on this page or use the example files if provided above.
- Click Download Template at the top of this page to download a GRT template file.
- In Grapher, click File | Open and open the file.
- Click Template | Populate Template to load your own data into the template.
Primary Categories: Multidimensional, Spatial
Industry Focuses: Aerospace, Aviation, Climate Science, Earth Science, Ecology, Engineering, Environmental Science, Geophysics, Infrastructure, Marine Science, Meteorology, Oceanography
Type: Vector