Piper Plot
Grapher Template by Golden Software
1029
1042
Piper Plot
(Template by Golden Software).grt
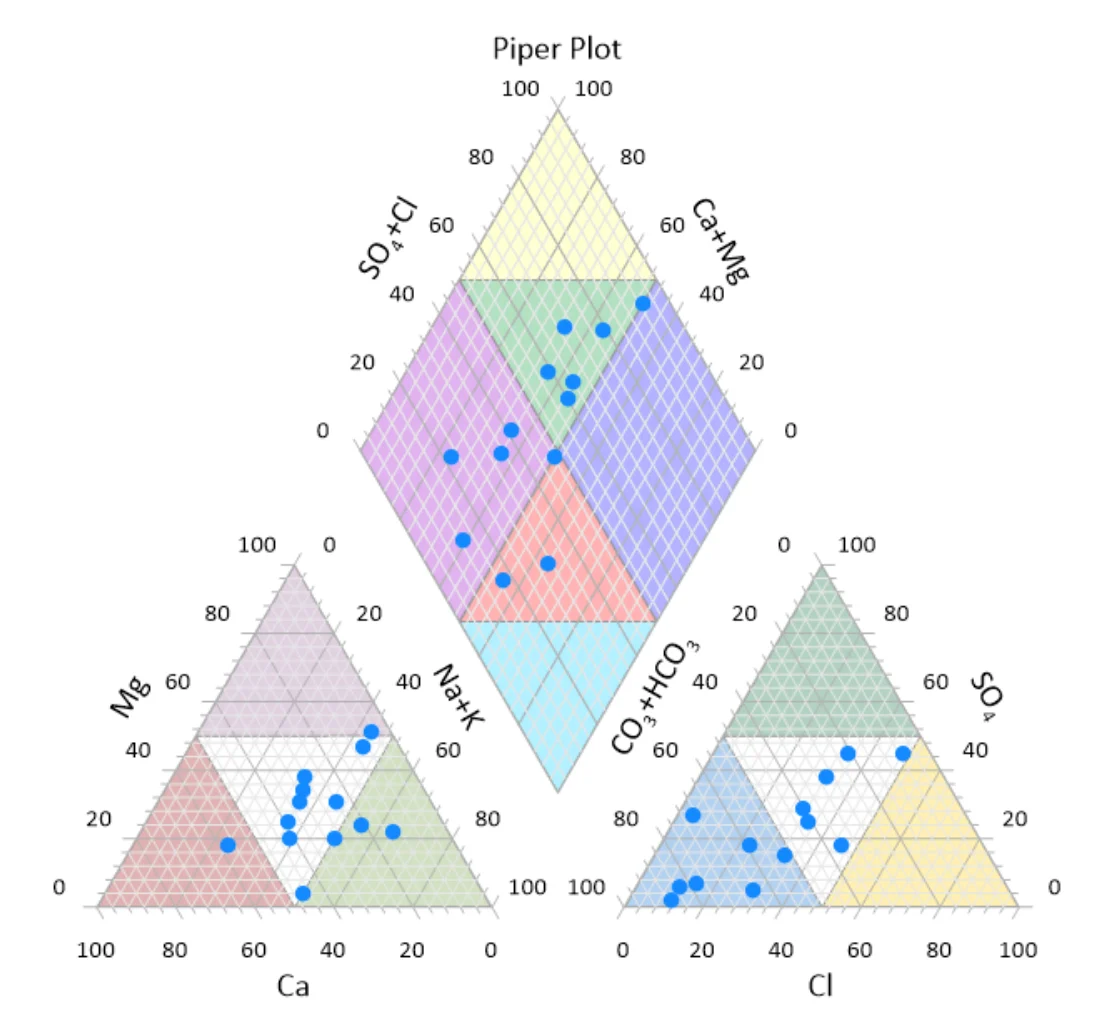
Piper plots are used in hydrogeochemistry to visualize the chemical makeup of water samples and classify water types. They help reveal patterns, mixing trends, and similarities in groundwater or surface water chemistry.
The two triangle plots show the relative proportions of major cations (Ca, Mg, Na+K) and anions (Cl, SO₄, CO₃+HCO₃), each summing to 100%. These are then combined into the central diamond, giving a clear, at-a-glance comparison across all samples.
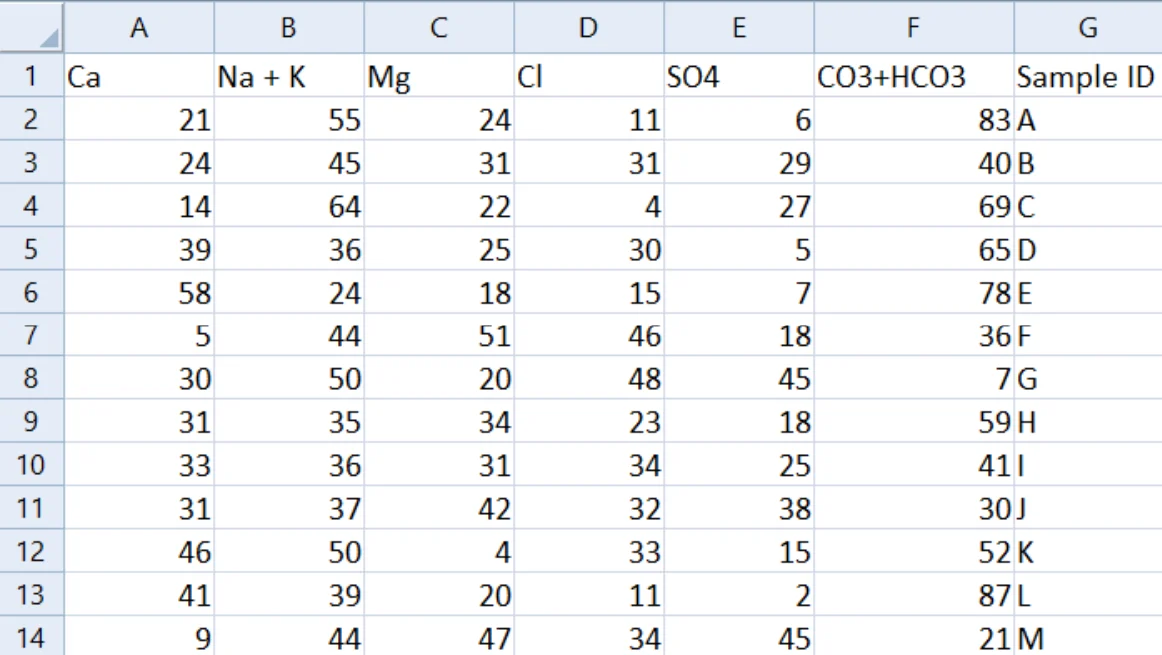
The data is organized into six columns – one for each ion group – making it easy to reuse this template with other water chemistry datasets.
Note: This Piper Plot template includes colored background segments to help identify common water chemistry types at a glance. If you prefer a cleaner look for reports or publications, you can easily turn off the colors by unchecking the “Chemistry Type Background Colors” item in the Object Manager.
The data for this template can be found below which you can download and adjust using your own data:
Industry Focus: Hydrogeochemistry, Water Management
Graph Features: Piper, Ternary
Instructions
To use this template in Grapher:
- For the best experience, structure your data in the same format shown on this page or use the example files if provided above.
- Click Download Template at the top of this page to download a GRT template file.
- In Grapher, click File | Open and open the file.
- Click Template | Populate Template to load your own data into the template.
Primary Categories: Multidimensional, Relational
Industry Focuses: Hydrogeochemistry, Water Management
Type: Piper, Ternary