Notched Box Plot
Grapher Template by Golden Software
335
488
Notched Box Plot
(Template by Golden Software).grt
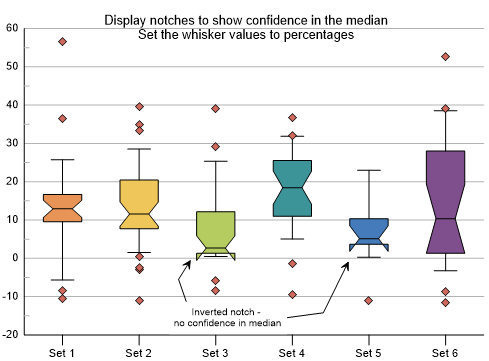
A Notched Box-and-Whisker Plot (or Notched Box Plot) is a variation of the standard box plot that includes notches around the median to indicate confidence intervals. The notches help visualize the uncertainty around the median and provide a quick way to assess statistical significance between groups. The width of the notch represents the variability in the median, making it easier to interpret differences across categories. If the notches of two box plots do not overlap, it suggests a significant difference between their medians at approximately the 95% confidence level. This plot type is commonly used for exploratory data analysis (EDA), hypothesis testing, and comparative studies.
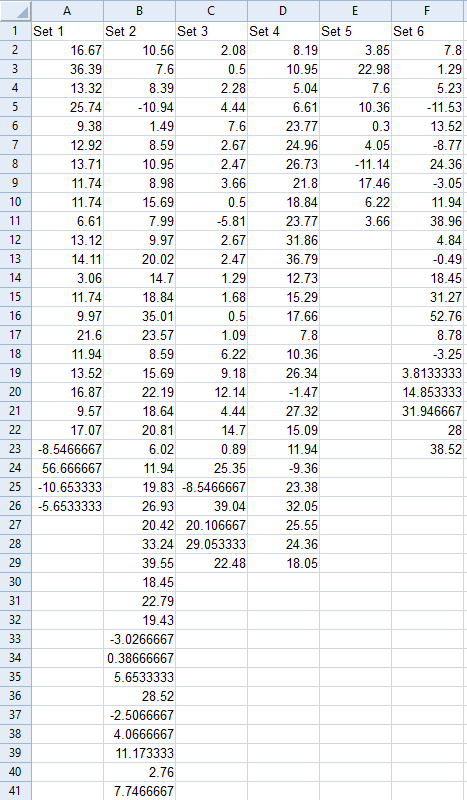
The data for this template can be found below which you can download and adjust using your own data:
Industry Focus: Data Science, Economics, Education, Engineering, Environmental Science, Finance, Geology, Healthcare, Manufacturing, Materials Science
Graph Features: Box
Instructions
To use this template in Grapher:
- For the best experience, structure your data in the same format shown on this page or use the example files if provided above.
- Click Download Template at the top of this page to download a GRT template file.
- In Grapher, click File | Open and open the file.
- Click Template | Populate Template to load your own data into the template.
Primary Categories: Statistical
Industry Focuses: Data Science, Economics, Education, Engineering, Environmental Science, Finance, Geology, Healthcare, Manufacturing, Materials Science
Type: Box