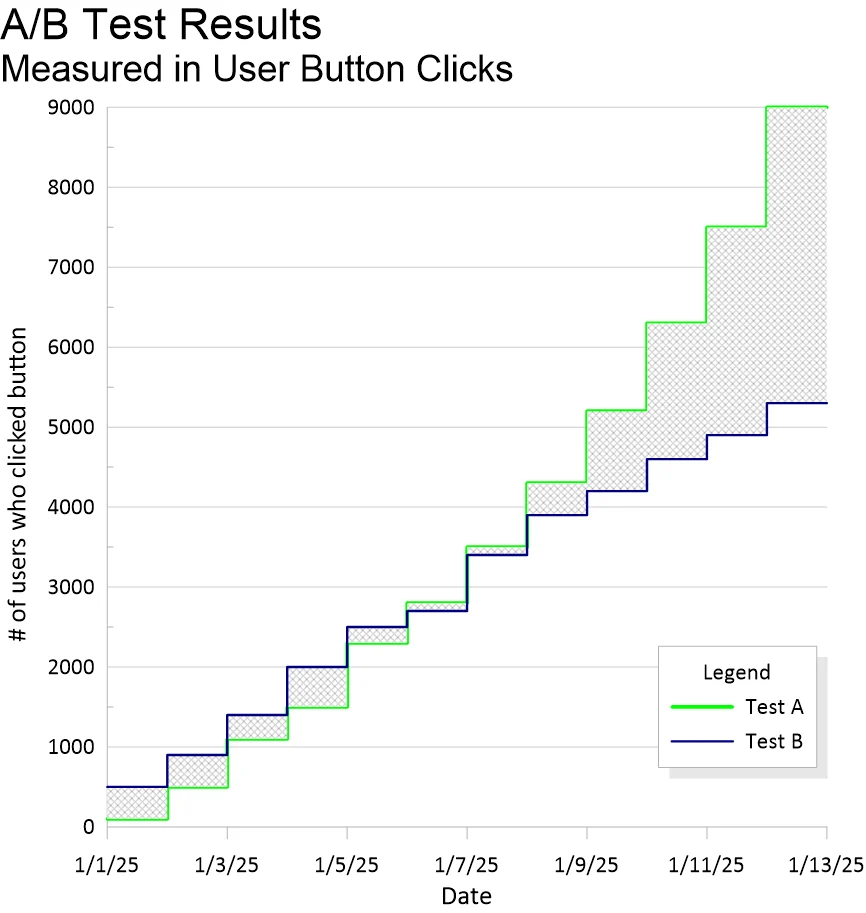
A/B Testing Results: User Clicks Over Time
Grapher Template by Golden Software
124
546
A/B Testing Results: User Clicks Over Time
(Template by Golden Software).grt
A Step Plot displaying cumulative changes in data over time, ideal for tracking trends that update at discrete intervals. This plot type is used to analyze event-driven changes, compare performance metrics, and monitor cumulative growth across various applications. The stepwise structure clearly represents moments when data shifts, making it valuable for financial trends, network monitoring, process control, A/B testing, epidemiology, and more. Commonly used in business intelligence, engineering, healthcare, and scientific research, this visualization highlights incremental progress and key transitions.
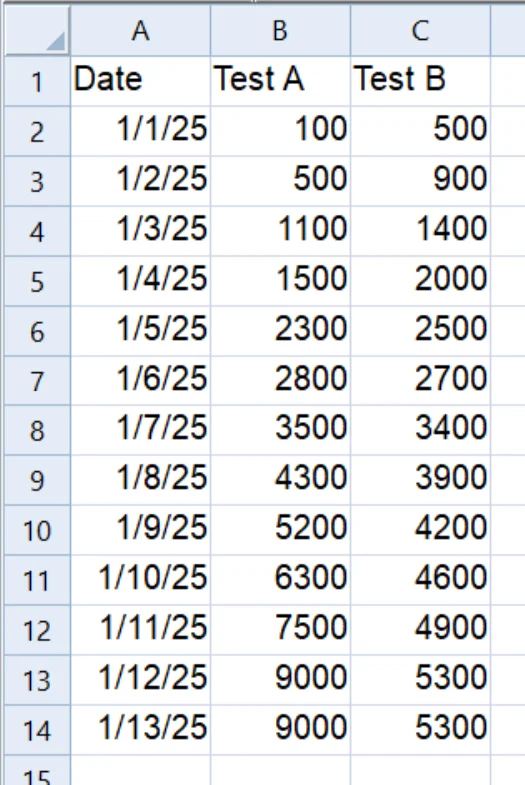
The data for this template can be found below which you can download and adjust using your own data:
Industry Focus: Analysis, Business, Engineering, Epidemiology, Finance, Healthcare, Manufacturing, Network Monitoring, Telecommunications
Graph Features: Step
Instructions
To use this template in Grapher:
- For the best experience, structure your data in the same format shown on this page or use the example files if provided above.
- Click Download Template at the top of this page to download a GRT template file.
- In Grapher, click File | Open and open the file.
- Click Template | Populate Template to load your own data into the template.
Primary Categories: Comparison, Spatial, Temporal
Industry Focuses: Analysis, Business, Engineering, Epidemiology, Finance, Healthcare, Manufacturing, Network Monitoring, Telecommunications
Type: Step