Ternary Frame
Grapher Template by Golden Software
273
595
Ternary Frame
(Template by Golden Software).grt
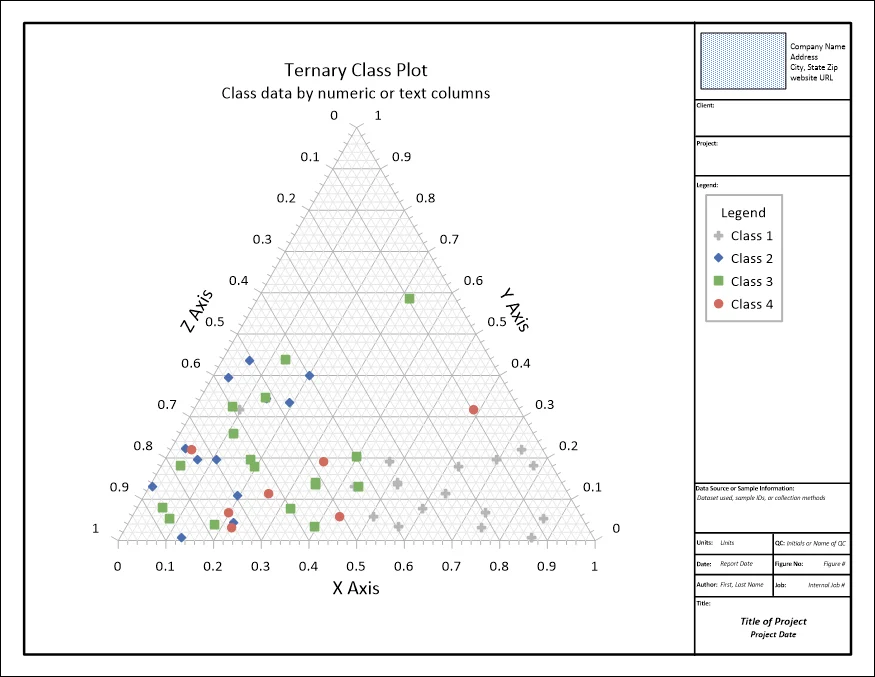
This template displays classified data on a ternary plot, a trilinear graph used to show the relative proportions of three components that sum to a constant (typically 100%). Each sample point on this template can be classified, such as sediment type, lithologic unit, water source, or soil texture, as well as color-coded to make patterns, clusters, and compositional trends easy to identify within the ternary space.
Ternary plots like this are widely used in geology, hydrogeochemistry, and environmental science. Some examples include:
-
Compare sand–silt–clay ratios in soil samples from different field sites
-
Classify groundwater samples by major ion composition to identify hydrochemical facies
-
Show how mineral proportions vary between rock formations in a mapped area
The plot is enclosed in a professional, ready-to-use report frame with labeled fields for project details, source data, figure numbers, and authorship, making it ideal for inclusion in technical reports, regulatory submissions, or internal documentation.
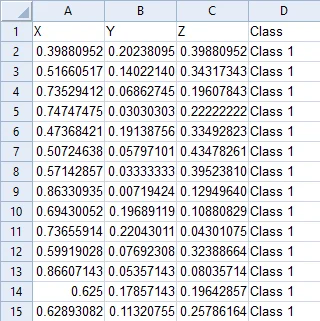
The data for this template can be found below which you can download and adjust using your own data:
Industry Focus: Civil Engineering, Environmental Science, Geochemistry, Geology, Geophysics, Hydrogeochemistry, Hydrogeology, Oil and Gas, Mining
Graph Features: Class, Ternary
Instructions
To use this template in Grapher:
- For the best experience, structure your data in the same format shown on this page or use the example files if provided above.
- Click Download Template at the top of this page to download a GRT template file.
- In Grapher, click File | Open and open the file.
- Click Template | Populate Template to load your own data into the template.
Primary Categories: Categorical, Comparison, Multidimensional, Proportional, Relational
Industry Focuses: Civil Engineering, Environmental Science, Geochemistry, Geology, Geophysics, Hydrogeochemistry, Hydrogeology, Mining, Oil and Gas
Type: Class, Ternary