Annual Wind Study
Grapher Template by Golden Software
116
197
Annual Wind Study
(Template by Golden Software).grt
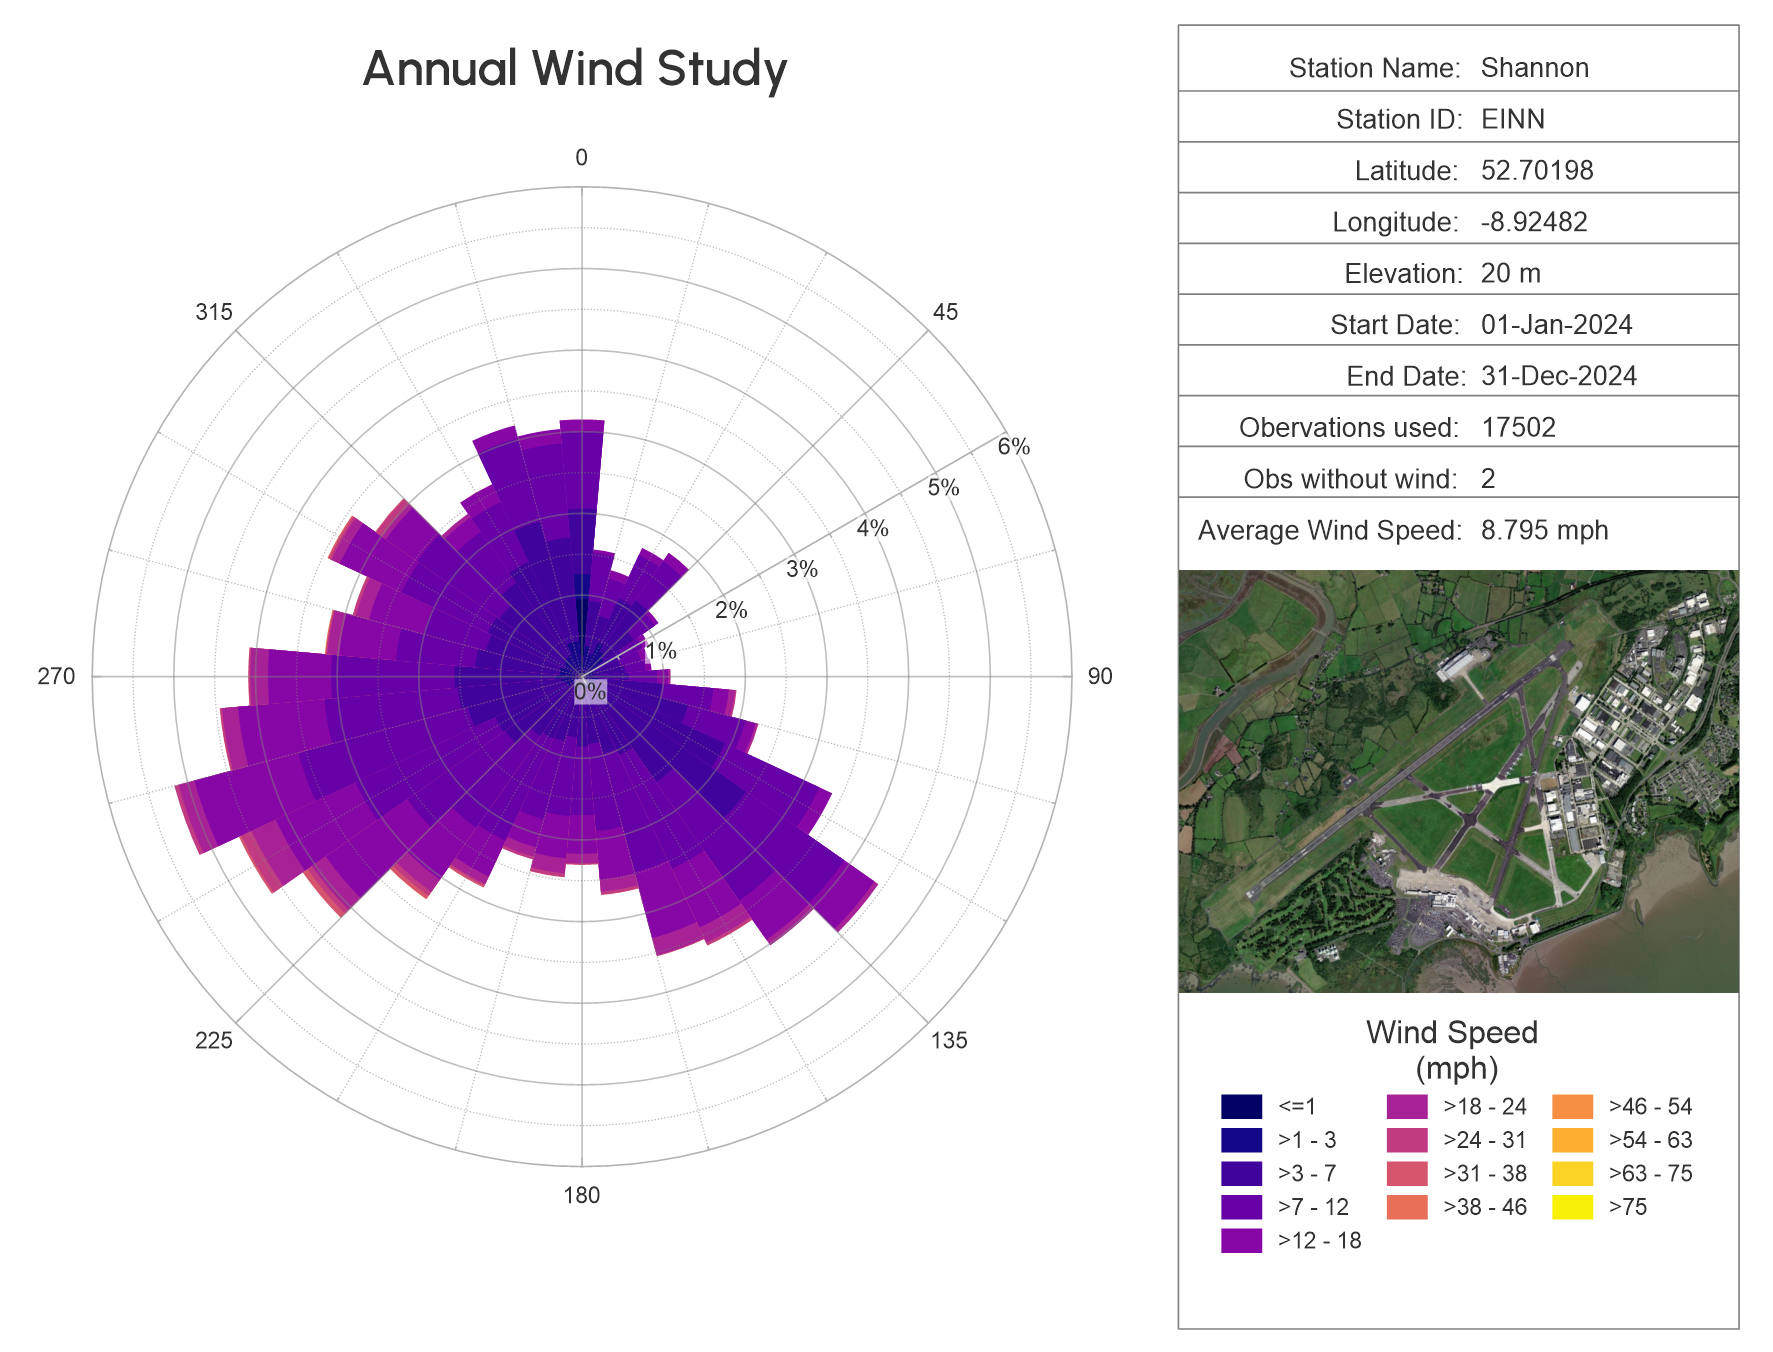
Wind Rose Chart provides a visual summary of wind speed and direction at a given location over a defined period of record. Each spoke shows the frequency with which the wind blew from that direction, while bar color represents different wind speed categories.
This template includes a wind rose plot with customizable metadata fields (station name, ID, coordinates, observation counts, and average wind speed), along with a placeholder for an optional site image. It offers a professional, ready-to-use format that makes it easy to highlight prevailing wind patterns and their intensity.
Wind Rose Charts are widely applied in:
-
Meteorology & Climatology – analyzing prevailing wind regimes
-
Environmental Science – studying pollutant or dust dispersion
-
Aviation & Transportation – assessing site safety and planning operations
-
Renewable Energy – evaluating sites for wind power development
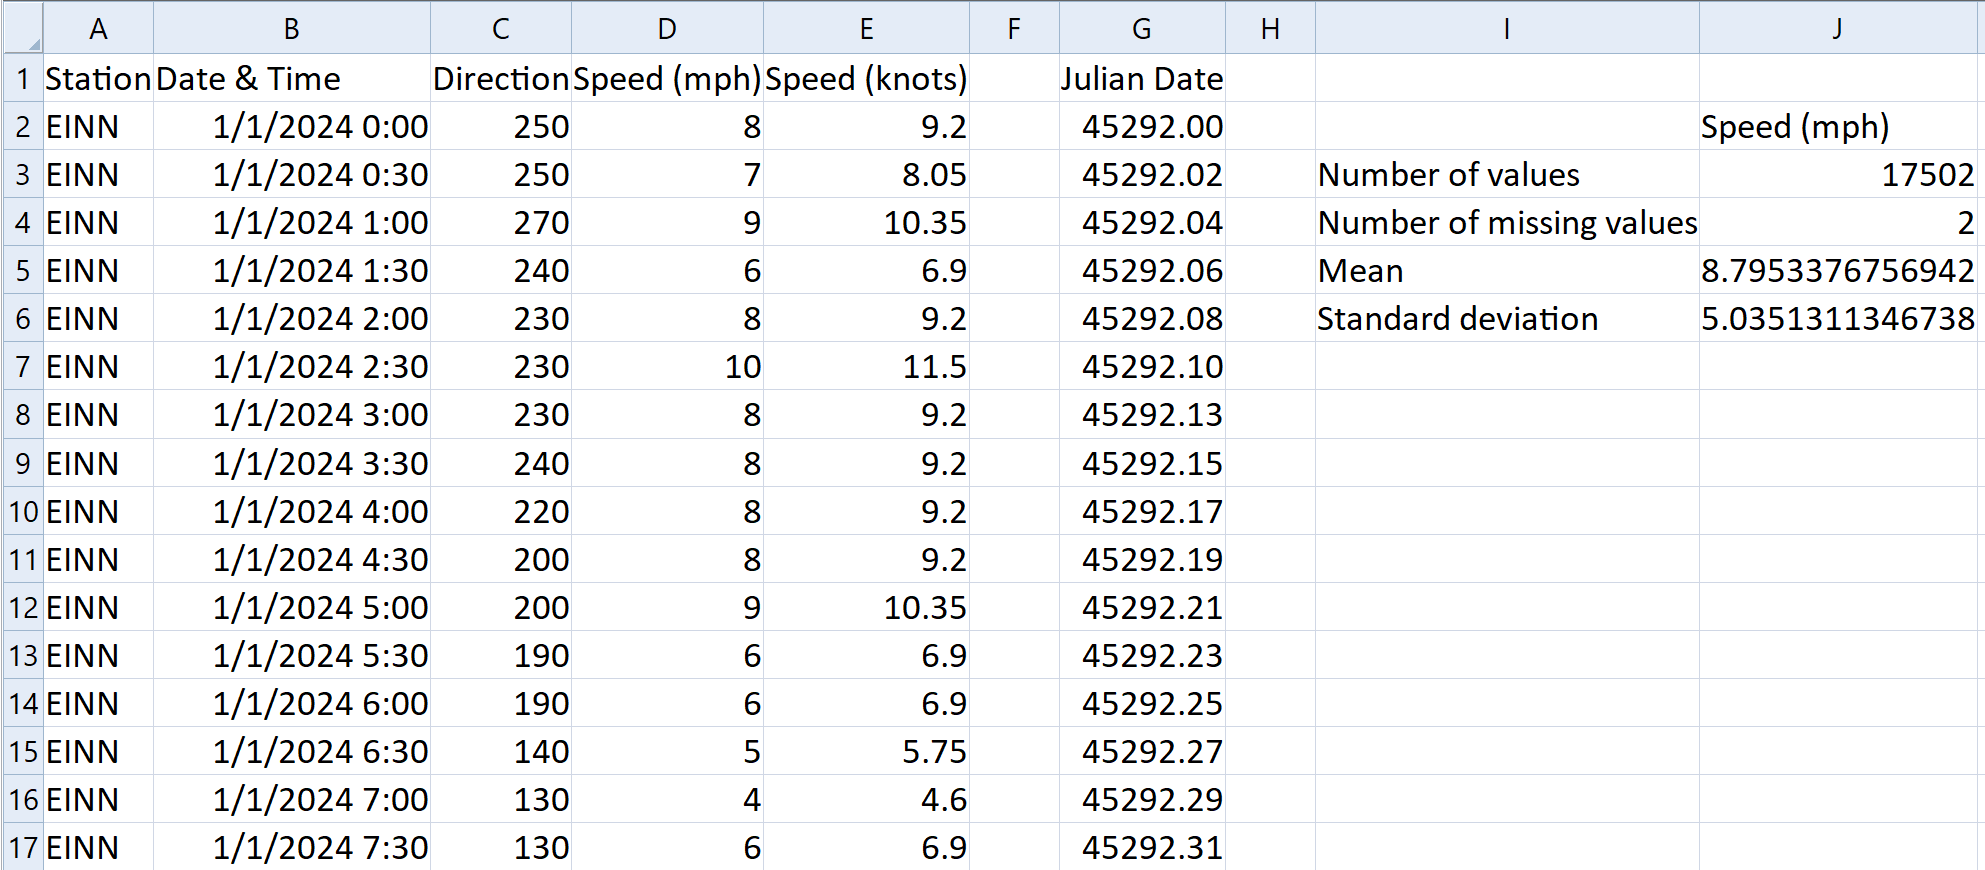
The data for this template can be found below which you can download and adjust using your own data:
Industry Focus: Aviation, Civil Engineering, Climate Science (Climatology), Environmental Science, Meteorology, Renewable Energy
Graph Features: Polar, Rose, Wind
Instructions
To use this template in Grapher:
- For the best experience, structure your data in the same format shown on this page or use the example files if provided above.
- Click Download Template at the top of this page to download a GRT template file.
- In Grapher, click File | Open and open the file.
- Click Template | Populate Template to load your own data into the template.
Primary Categories: Distributive, Spatial, Temporal
Industry Focuses: Aviation, Civil Engineering, Climate Science, Environmental Science, Meteorology, Renewable Energy
Type: Polar, Rose, Wind

