Arrhenius Plot
Grapher Template by Golden Software
316
570
Arrhenius Plot
(Template by Golden Software).grt
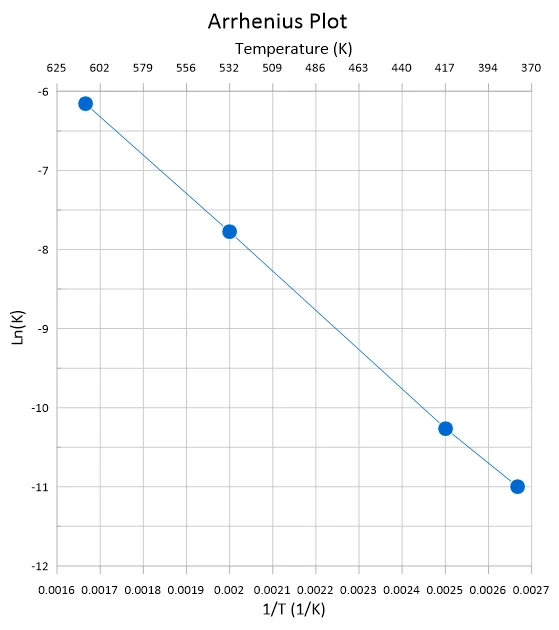
Arrhenius plots are used to analyze how temperature affects the rate of a chemical reaction. By plotting the natural log of the rate constant (ln(k)) against the inverse of temperature (1/T), this graph reveals a linear trend that can be used to calculate activation energy. It’s a staple in chemical kinetics for modeling temperature-dependent behavior.
This plot is frequently used in the pharmaceutical, food, materials, and chemical engineering industries to predict shelf life, reaction rates, material degradation, and temperature sensitivity of processes or products.
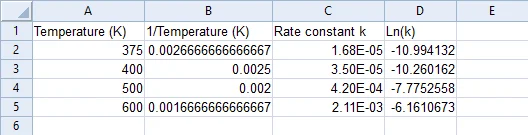
The data for this template can be found below which you can download and adjust using your own data:
Industry Focus: Food Science, Health Systems, Materials Science, Pharmaceuticals
Graph Features: Line, Scatter
Instructions
To use this template in Grapher:
- For the best experience, structure your data in the same format shown on this page or use the example files if provided above.
- Click Download Template at the top of this page to download a GRT template file.
- In Grapher, click File | Open and open the file.
- Click Template | Populate Template to load your own data into the template.
Primary Categories: Relational
Industry Focuses: Food Science, Health Systems, Materials Science, Pharmaceutical
Type: Line, Scatter