Chadha Diagram
Grapher Template by Golden Software
332
615
Chadha Diagram
(Template by Golden Software).grt
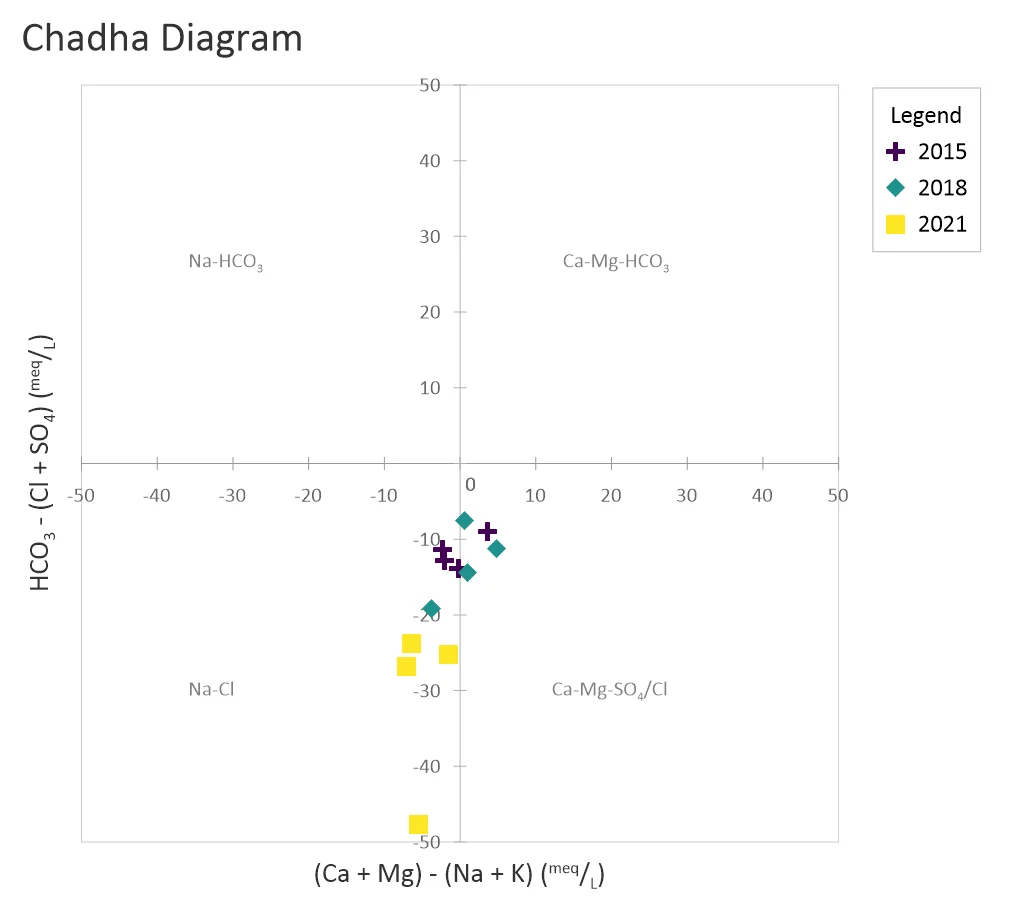
A Chadha Diagram is a hydrogeochemical tool used to classify groundwater facies and interpret dominant geochemical processes. Instead of plotting individual ions directly, the diagram transforms them into two composite indices: the difference between alkaline earths (Ca²⁺ + Mg²⁺) and alkali metals (Na⁺ + K⁺) on the x-axis, and the difference between weak acidic anions (HCO₃⁻) and strong acidic anions (Cl⁻ + SO₄²⁻) on the y-axis.
Each quadrant represents a distinct hydrochemical facies:
-
Ca–Mg–HCO₃ facies often linked to recharge and active rock weathering
-
Na–HCO₃ facies commonly formed by ion exchange
-
Na–Cl facies associated with salinity intrusion, evaporation, or contamination
-
Ca–Mg–SO₄/Cl facies indicating gypsum/anhydrite dissolution or mixing with sulfate- and chloride-rich sources
In this example, samples from 2015, 2018, and 2021 are plotted with different symbols and colors, making it easy to track how groundwater chemistry has shifted over time. By comparing the position of samples across years, users can detect changes due to processes like ion exchange, mineral dissolution, or mixing with different water sources.
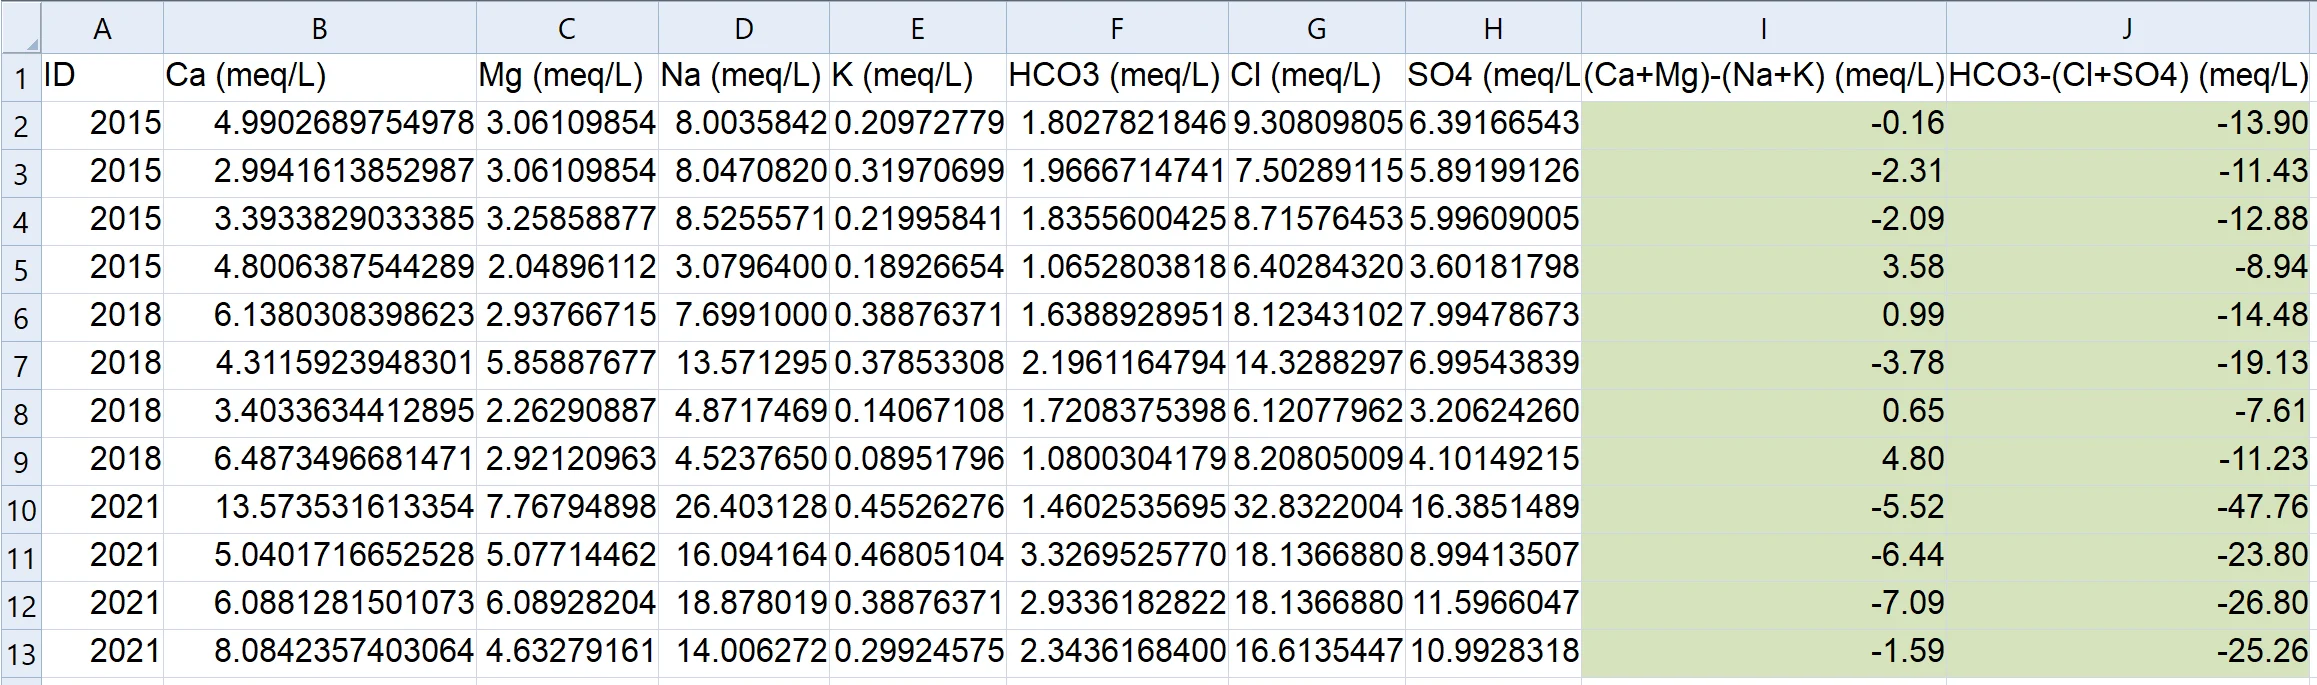
The data for this template can be found below which you can download and adjust using your own data:
Industry Focus: Environmental Science, Hydrogeochemistry, Hydrology, Water Resources, Water Management
Graph Features: Class, Scatter
Instructions
To use this template in Grapher:
- For the best experience, structure your data in the same format shown on this page or use the example files if provided above.
- Click Download Template at the top of this page to download a GRT template file.
- In Grapher, click File | Open and open the file.
- Click Template | Populate Template to load your own data into the template.
Primary Categories: Comparison, Temporal
Industry Focuses: Environmental Science, Hydrogeochemistry, Hydrogeology, Water Management, Water Resources
Type: Class, Scatter