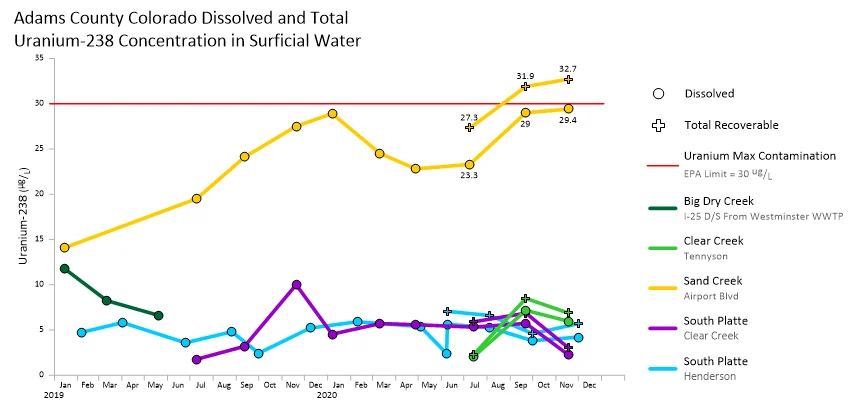
Contaminants in Surface Water
Grapher Template by Golden Software
248
602
Contaminants in Surface Water
(Template by Golden Software).grt
This template is ideal for visualizing how values change over time across multiple locations or categories. Line and symbol plots make it easy to compare trends between sites, and the optional threshold line highlights exceedances of a defined limit or guideline.
Best suited for environmental monitoring, compliance reporting, or any application where it’s important to track and compare temporal changes across groups.
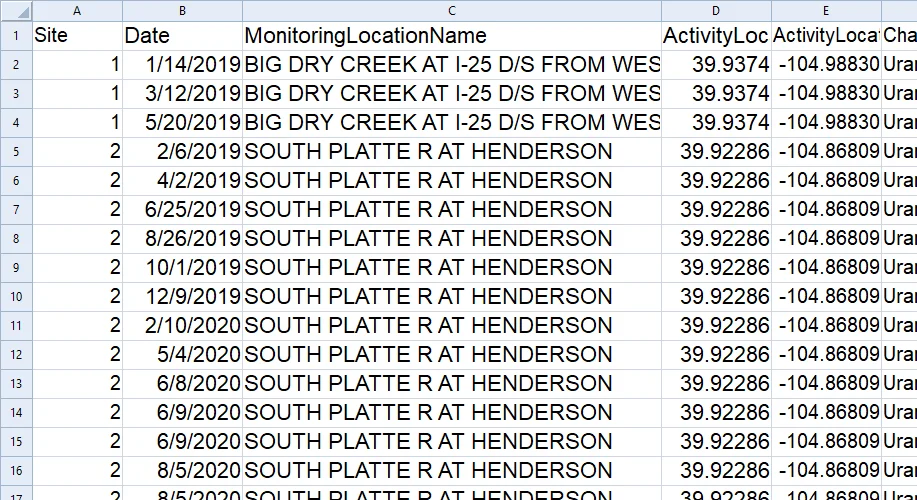
The data for this template can be found below which you can download and adjust using your own data:
Industry Focus: Agriculture, Chemistry, Manufacturing, Mining, Oil and Gas, Water Management, Water Treatment
Graph Features: Line
Instructions
To use this template in Grapher:
- For the best experience, structure your data in the same format shown on this page or use the example files if provided above.
- Click Download Template at the top of this page to download a GRT template file.
- In Grapher, click File | Open and open the file.
- Click Template | Populate Template to load your own data into the template.
Primary Categories: Comparison, Temporal
Industry Focuses: Agriculture, Chemistry, Manufacturing, Mining, Oil and Gas, Water Management, Water Treatment
Type: Line