Contour Frame
Grapher Template by Golden Software
233
629
Contour Frame
(Template by Golden Software).grt
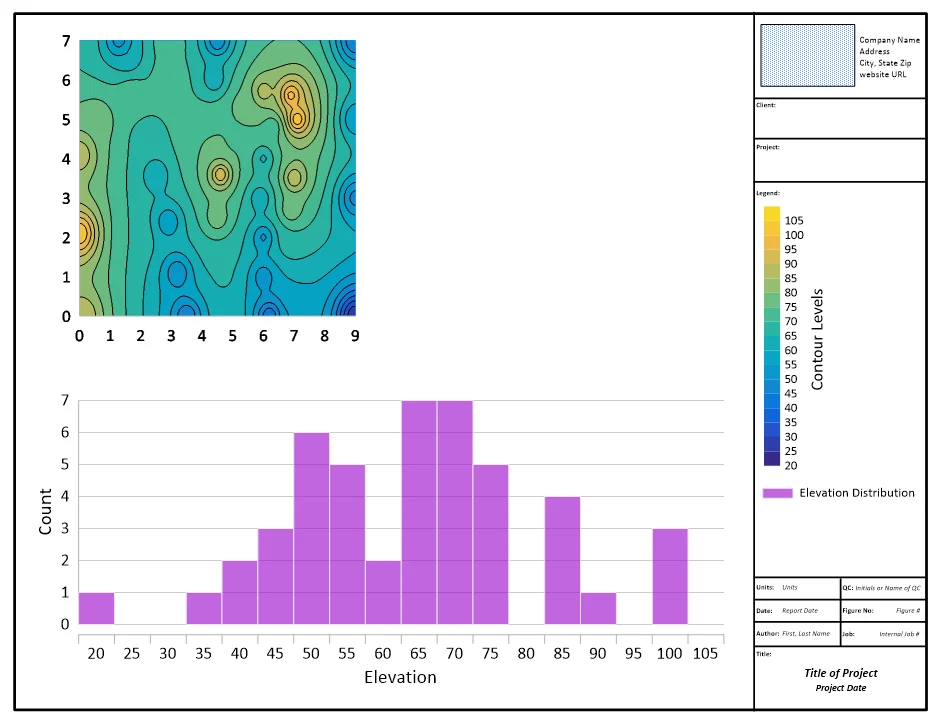
This template provides a prearranged frame layout with company information, project details, etc., for structuring results to communicate in a report. Use any XYZ data in this template to display a contour map showing the Z values by color and a histogram of the Z values distribution.
One example application of this template is to show how the concentration of a contaminant (Z) affects a certain area (XY). The contour map illustrates the spatial relationship to identify where the contaminant is higher or lower in value, and the histogram helps understand the proportion of contaminant concentration above a certain threshold or where the levels skew.
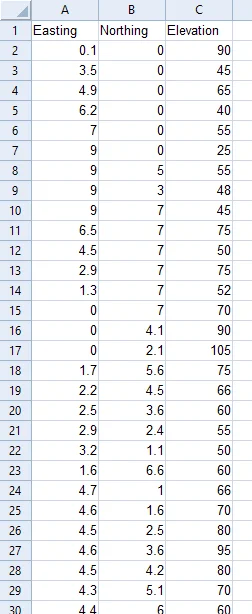
The data for this template can be found below which you can download and adjust using your own data:
Industry Focus: Civil Engineering, Construction, Geology, Environmental Science, Meteorology, Climate Science, Agriculture, Oceanography
Graph Features: Contour, Frame, Histogram
Instructions
To use this template in Grapher:
- For the best experience, structure your data in the same format shown on this page or use the example files if provided above.
- Click Download Template at the top of this page to download a GRT template file.
- In Grapher, click File | Open and open the file.
- Click Template | Populate Template to load your own data into the template.
Primary Categories: Spatial
Industry Focuses: Agriculture, Civil Engineering, Climate Science, Construction, Environmental Science, Geology, Meteorology, Oceanography
Type: Contour, Frame, Histogram