Cumulative CO2 Emissions
Grapher Template by Golden Software
157
512
Cumulative CO2 Emissions
(Template by Golden Software).grt
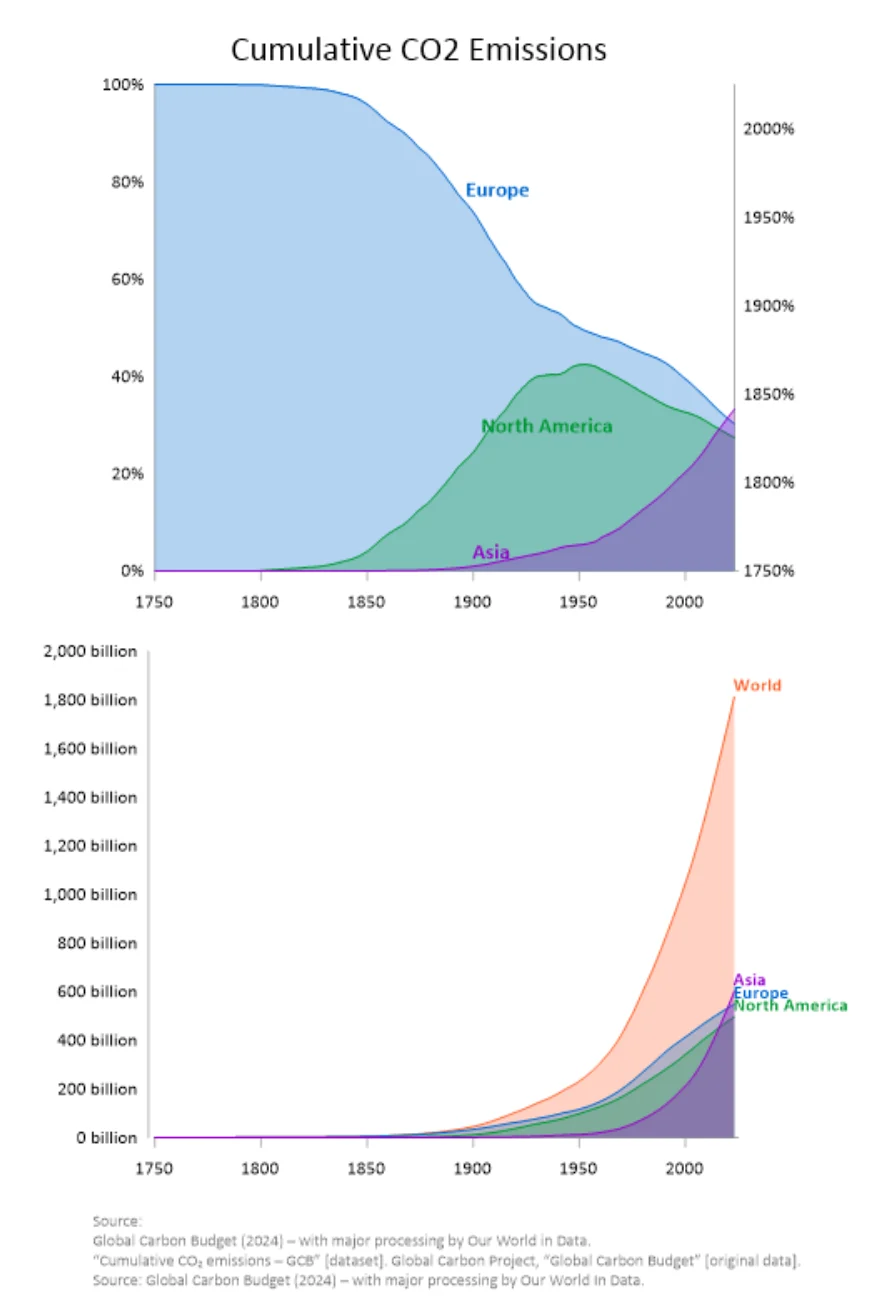
This chart shows how CO₂ emissions have grown and shifted across regions over time. The top plot uses a stacked area chart to show each region’s share of global emissions, while the bottom plot shows the total emissions by region. Together, they reveal both the scale and the changing contributions of each region from 1750 to today.
A stacked chart like this is especially useful for showing how individual parts contribute to a larger total and how those contributions shift over time – like population by region, global health outbreaks by country, or electric vehicle adoption by continent. Just plug in your own data by category and year to explore how the story changes over time.
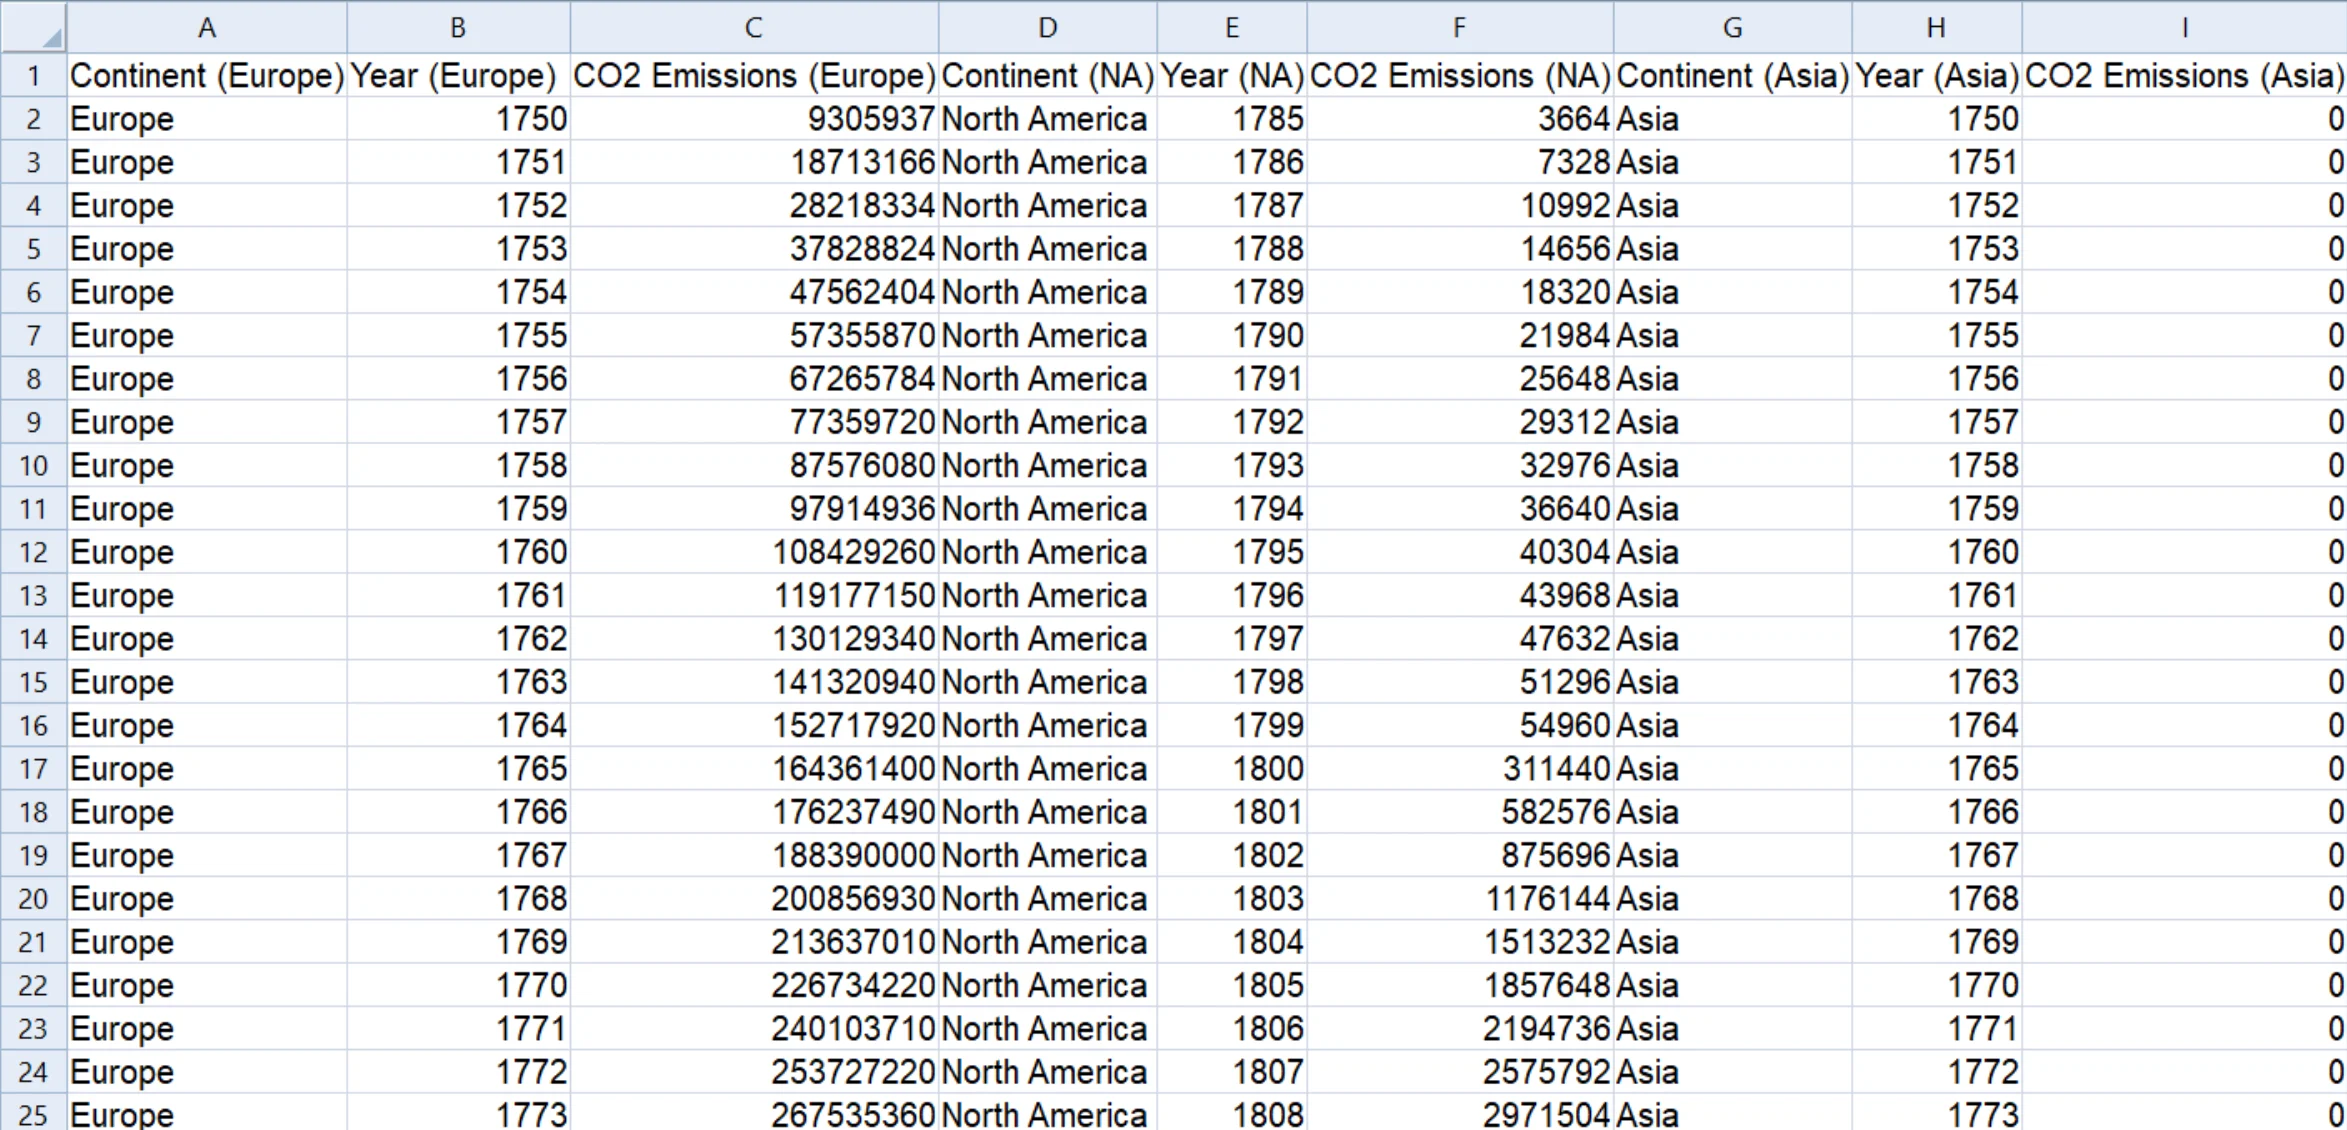
The data for this template can be found below which you can download and adjust using your own data:
Industry Focus: Climate Science, Environmental Science, Healthcare, Health Systems
Graph Features: Line, Math
Instructions
To use this template in Grapher:
- For the best experience, structure your data in the same format shown on this page or use the example files if provided above.
- Click Download Template at the top of this page to download a GRT template file.
- In Grapher, click File | Open and open the file.
- Click Template | Populate Template to load your own data into the template.
Primary Categories: Cumulative, Proportional, Temporal
Industry Focuses: Climate Science, Environmental Science, Health Systems, Healthcare
Type: Line, Math