Drillhole Logs
Grapher Template by Golden Software
478
643
Drillhole Logs
(Template by Golden Software).grt
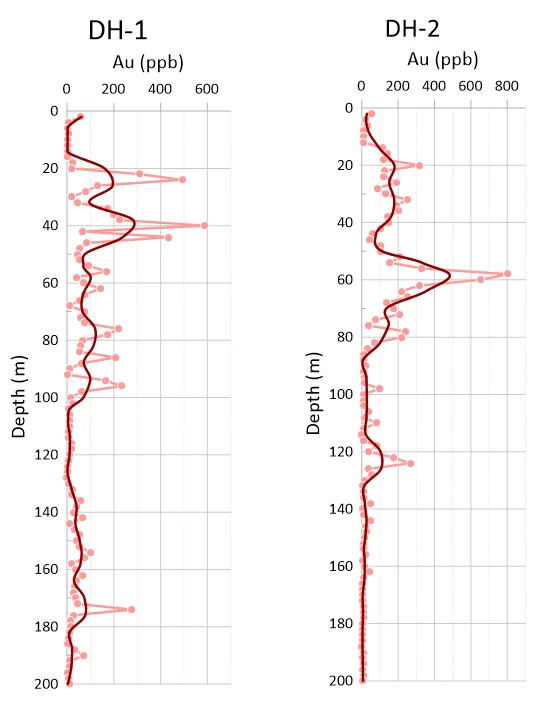
This plot type shows downhole geochemical profiles for multiple drillholes. Sample values are plotted as points along depth, with an overlaid smoothed trend line to highlight overall concentration patterns. The plot provides a clear visual comparison of grade variability between drillholes.
The data for this template can be found below which you can download and adjust using your own data:
Industry Focus: Environmental Science
Graph Features: Fit, Scatter
Instructions
To use this template in Grapher:
- For the best experience, structure your data in the same format shown on this page or use the example files if provided above.
- Click Download Template at the top of this page to download a GRT template file.
- In Grapher, click File | Open and open the file.
- Click Template | Populate Template to load your own data into the template.
Primary Categories: Relational, Spatial
Industry Focuses: Environmental Science
Type: Fit, Scatter