Durov Plot
Grapher Template by Golden Software
355
659
Durov Plot
(Template by Golden Software).grt
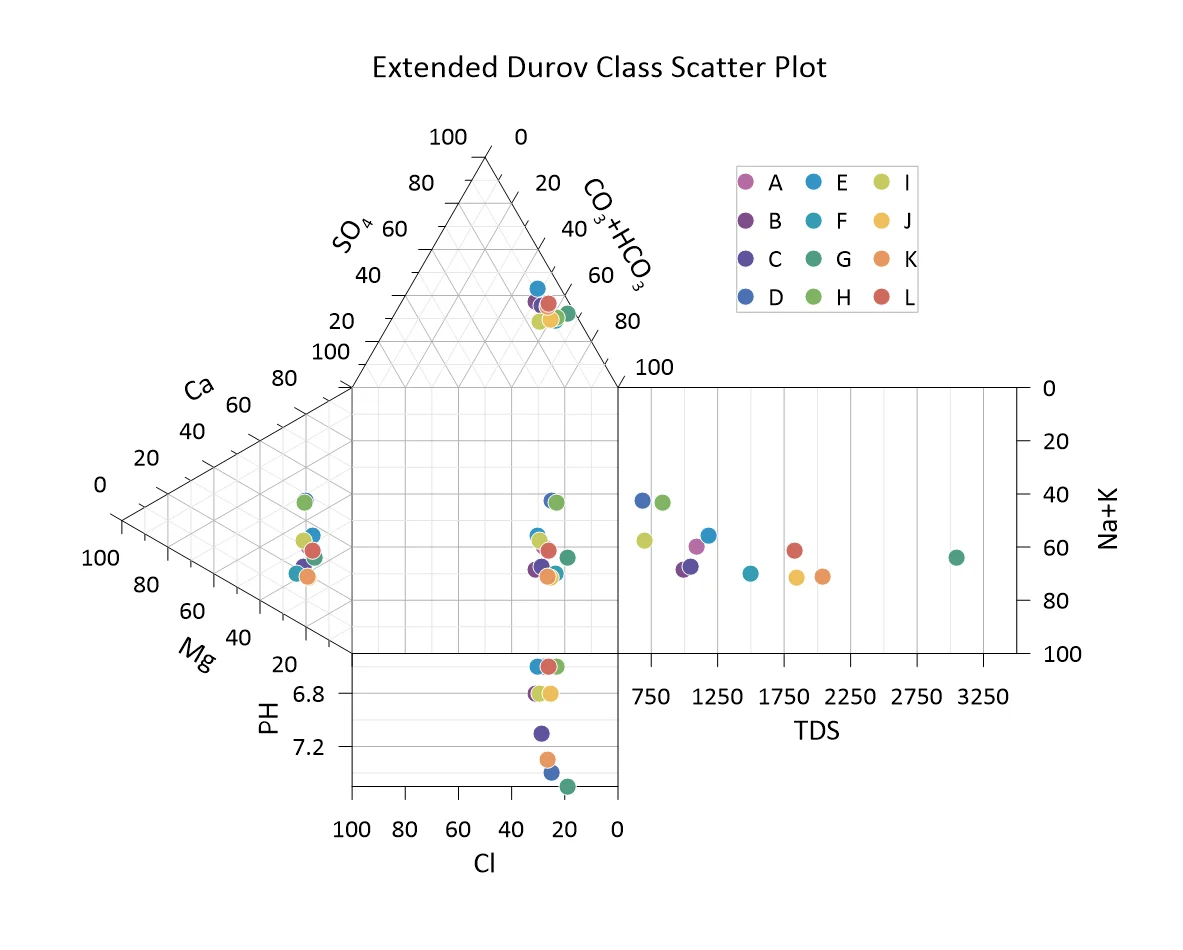
An Extended Durov plot is a powerful tool for visualizing the chemistry of water samples. They combine two ternary diagrams (cations and anions) with rectangular fields that typically show pH and total dissolved solids (TDS). This layout helps identify hydrochemical facies, mixing processes, and geochemical evolution patterns across multiple water samples.
The template includes labeled axes for all key ions – Ca, Mg, Na+K, Cl, SO₄, and CO₃+HCO₃ – as well as pH and TDS. Sample ID points are color-coded by group classification for easy comparison, and the plot layout makes it simple to interpret complex water chemistry patterns.
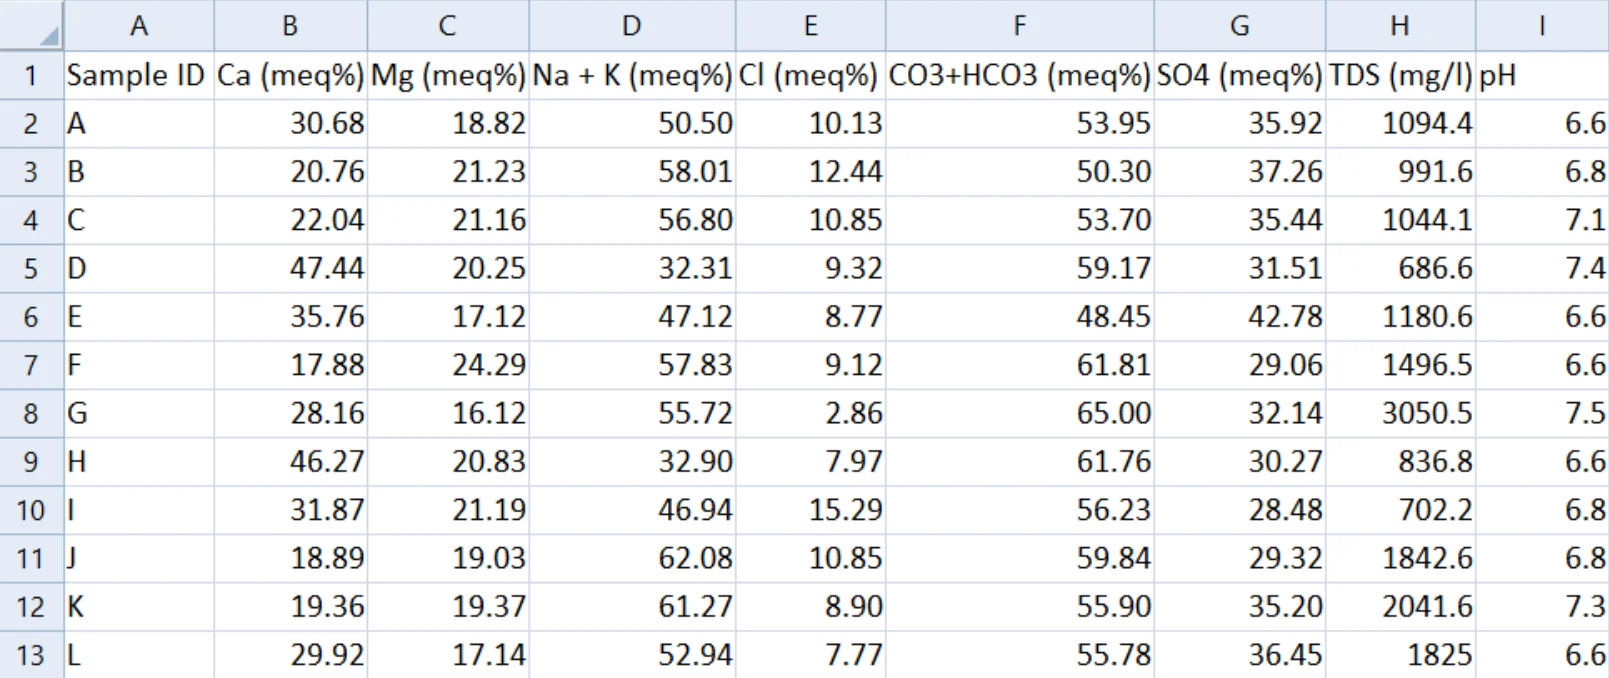
Your data sheet just needs one column for each ion group, plus pH, TDS, and an optional grouping or ID column – so adapting the template to your own data is quick and straightforward.
The data for this template can be found below which you can download and adjust using your own data:
Industry Focus: Agriculture, Civil Engineering, Hydrogeology, Oil and Gas
Graph Features: Scatter, Ternary
Instructions
To use this template in Grapher:
- For the best experience, structure your data in the same format shown on this page or use the example files if provided above.
- Click Download Template at the top of this page to download a GRT template file.
- In Grapher, click File | Open and open the file.
- Click Template | Populate Template to load your own data into the template.
Primary Categories: Multidimensional, Statistical
Industry Focuses: Agriculture, Civil Engineering, Hydrogeology, Oil and Gas
Type: Scatter, Ternary