Environmental Template
Grapher Template by Golden Software
1021
834
Environmental Template
(Template by Golden Software).grt
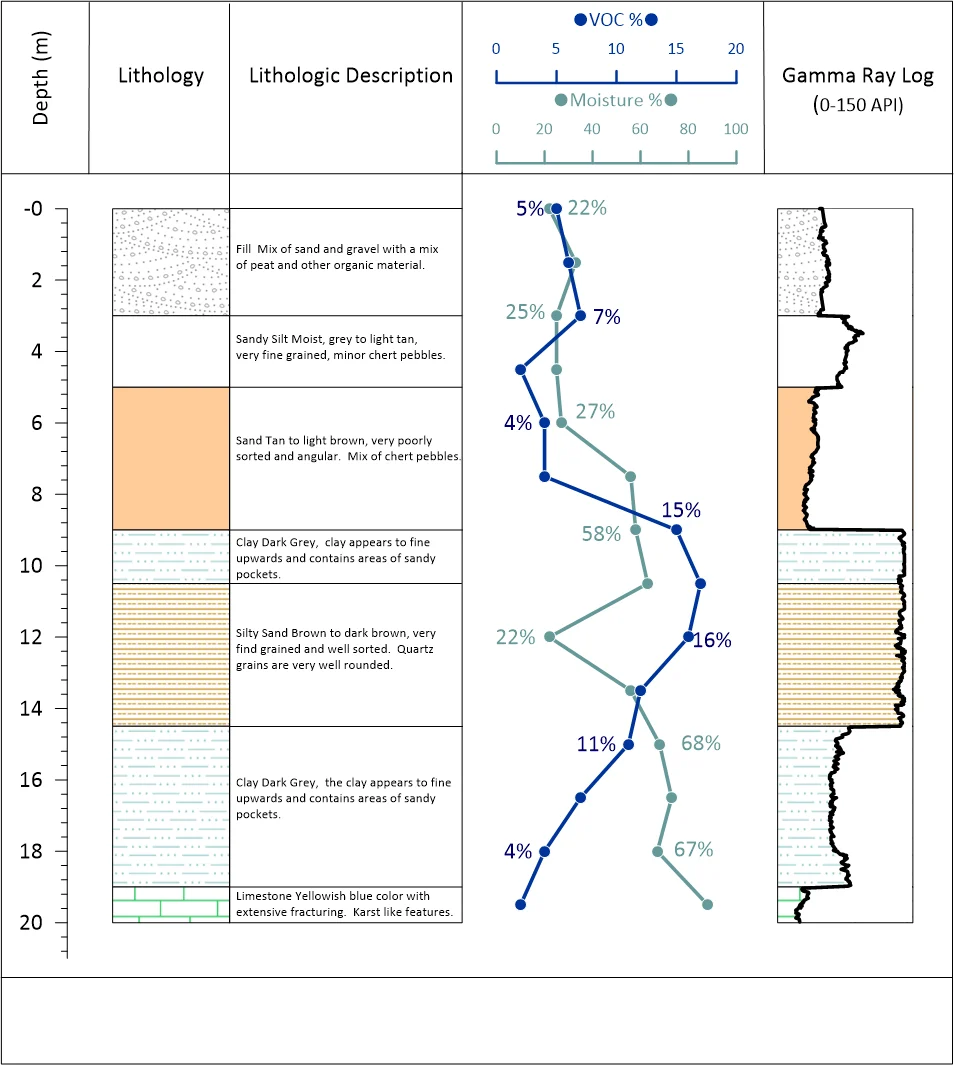
This template presents a full environmental borehole log, integrating lithology, descriptive soil layers, analytical measurements, and a gamma ray geophysical log – all aligned by depth. It provides a clear and practical way to visualize subsurface conditions, making it especially useful for environmental investigations, site characterization, and remediation planning.
The left side displays lithologic units with patterns, color fills, and associated descriptions. The center plots show percent VOCs and moisture content sampled at various depths, while the right side includes a gamma ray log to help correlate physical and geophysical properties across the borehole.
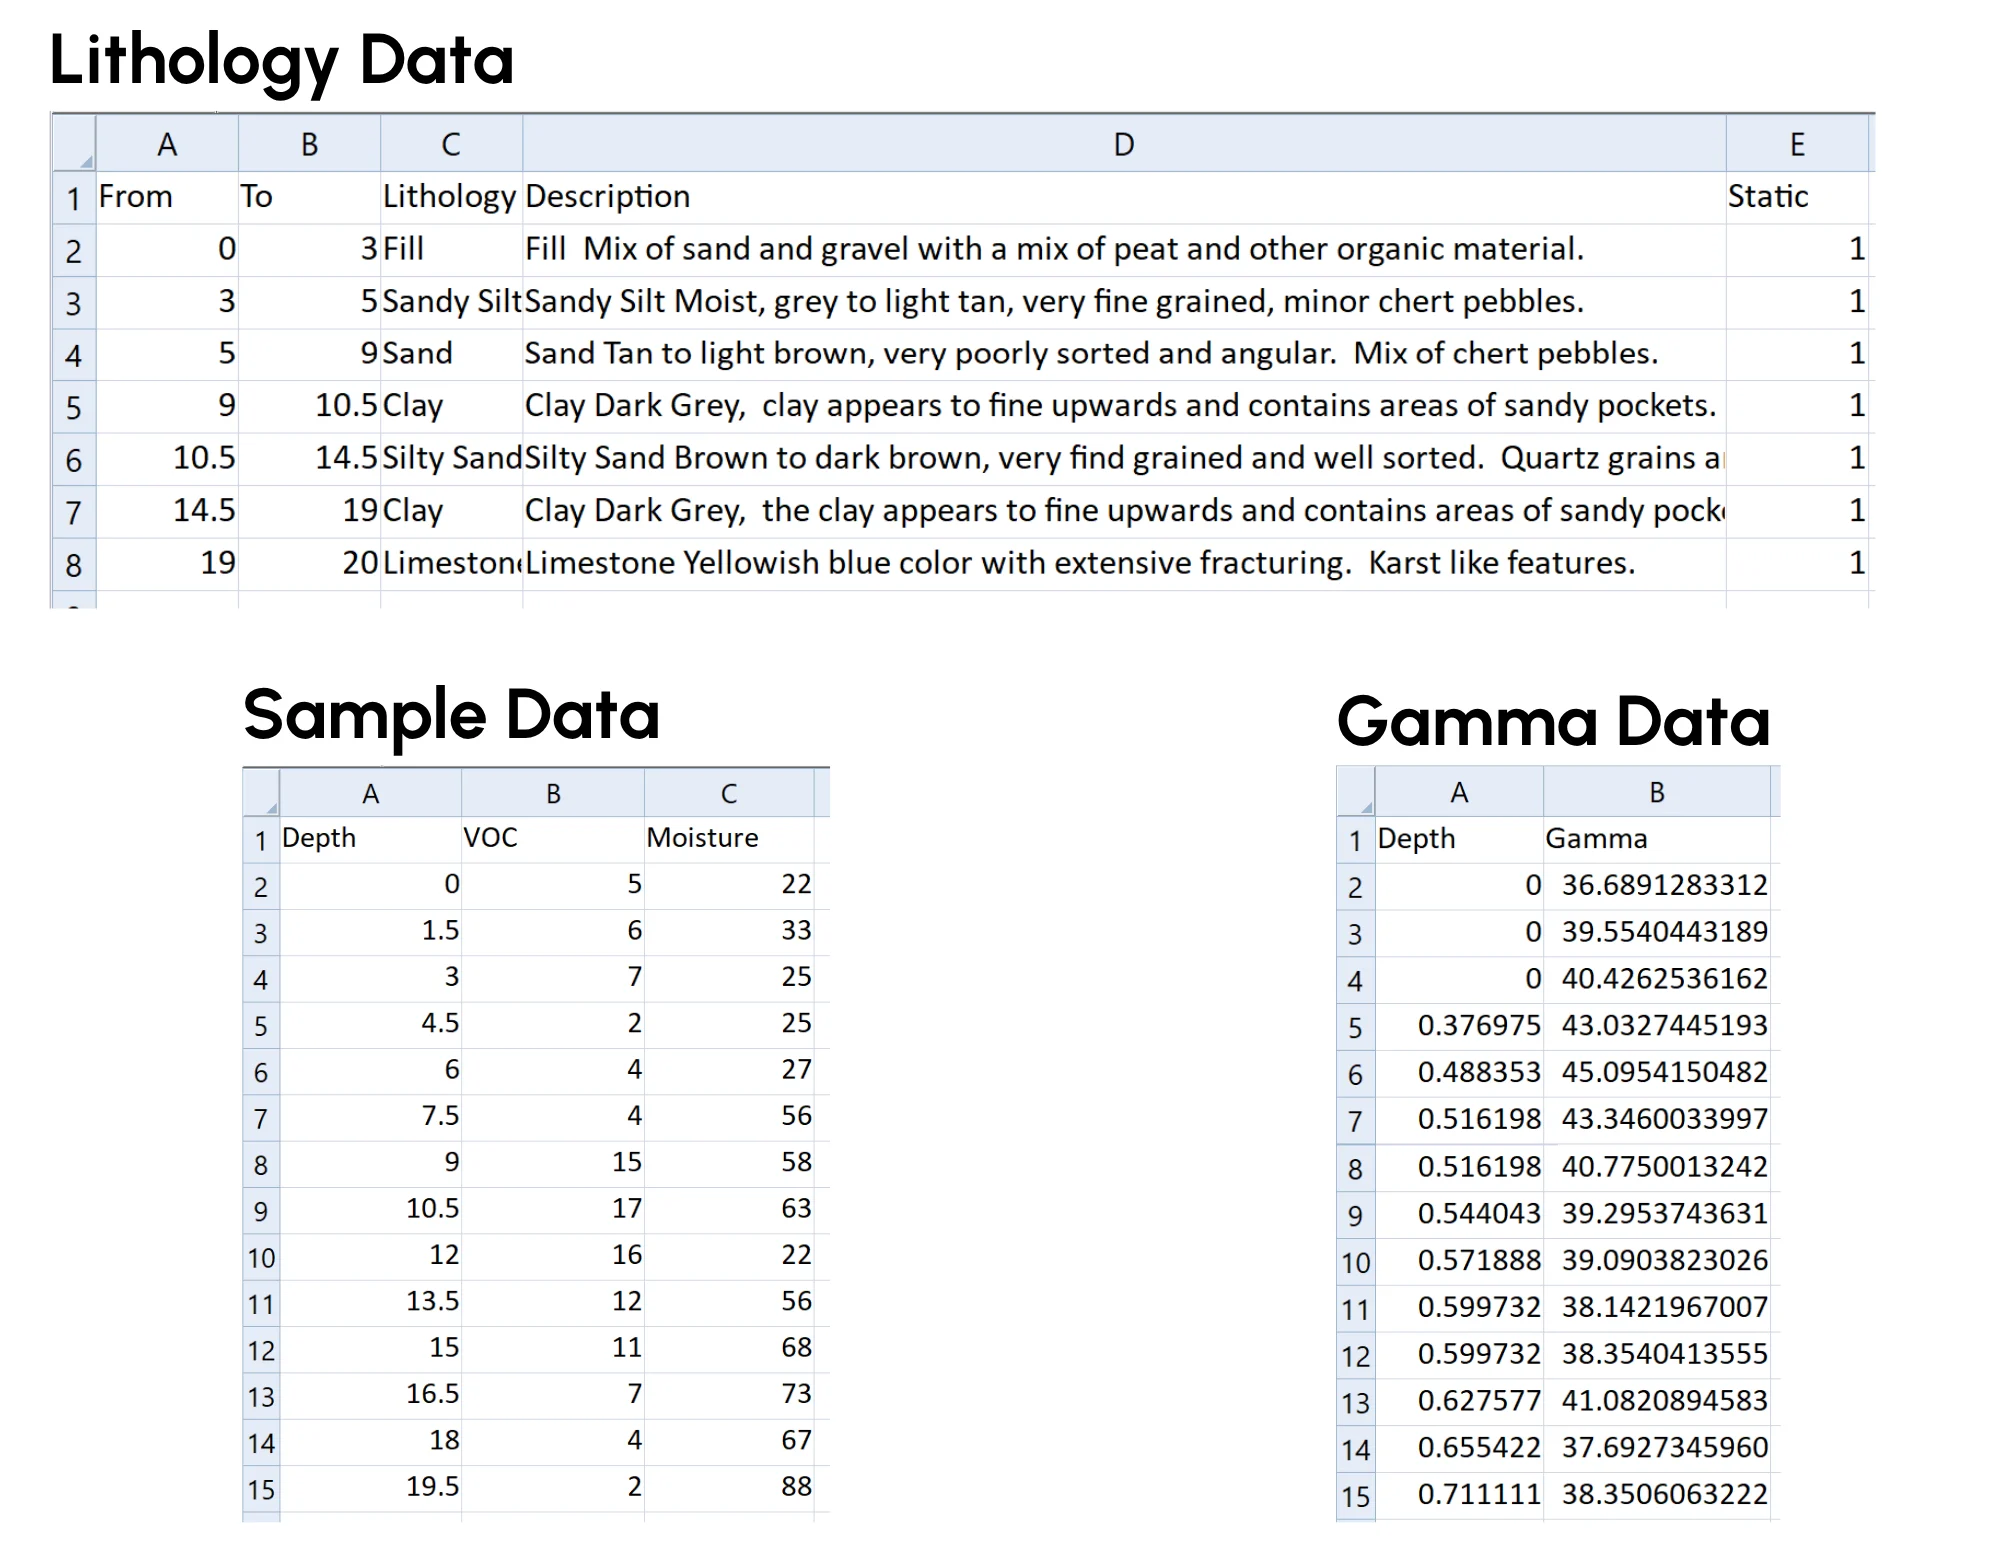
The data for this template comes from three separate data sheets which you can download and adjust using your own data:
-
Lithology-Data.xlsx defines the soil layers, depths, materials, and descriptions used in the lithology column. Note, this uses a ‘Static’ column with a constant value for making a block display from floating bars.
-
Sample-Data.xlsx contains depth-based sample data for VOCs and moisture, which are plotted as line graphs with point labels.
- Gamma-Data.xlsx contains depth-based gamma ray data, which is plotted as a line graph.
All sheets must use the same units of depth (eg. meters) and align along a common vertical scale to ensure accurate visualization.
Industry Focus: Mining, Oil and Gas, Water Resources
Graph Features: Floating Bar, Line
Instructions
To use this template in Grapher:
- For the best experience, structure your data in the same format shown on this page or use the example files if provided above.
- Click Download Template at the top of this page to download a GRT template file.
- In Grapher, click File | Open and open the file.
- Click Template | Populate Template to load your own data into the template.
Primary Categories: Categorical, Multidimensional, Spatial
Industry Focuses: Mining, Oil and Gas, Water Resources
Type: Floating Bar, Line