European Flood Events Time Series
Grapher Template by Golden Software
13
27
European Flood Events Time Series
(Template by Golden Software).grt
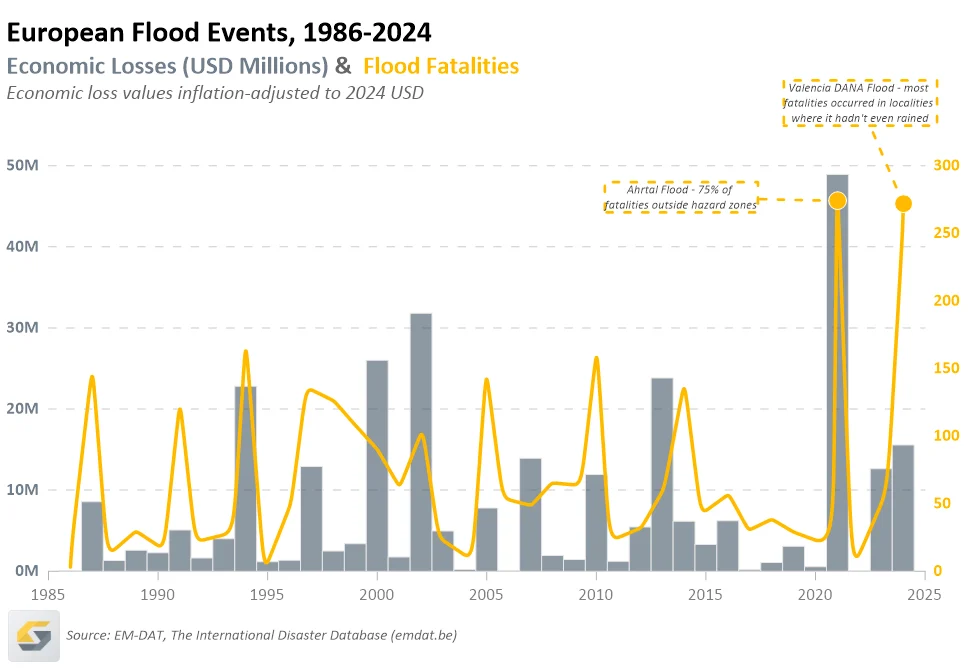
This template combines a bar chart and line plot on dual axes to present two related variables over time, such as economic losses and flood fatalities. The bars show magnitude, while the line highlights trends, making it easy to compare how impacts and outcomes change together across the same time period. Annotations can be added to call out significant events or anomalies.
This type of visualization is widely used to analyze relationships in time series data. In science and engineering, it is effective for comparing linked variables such as precipitation and runoff, seismic activity and damage, or temperature and energy demand. It is also commonly used in economics, public health, and risk analysis to understand how one metric responds to another over time.
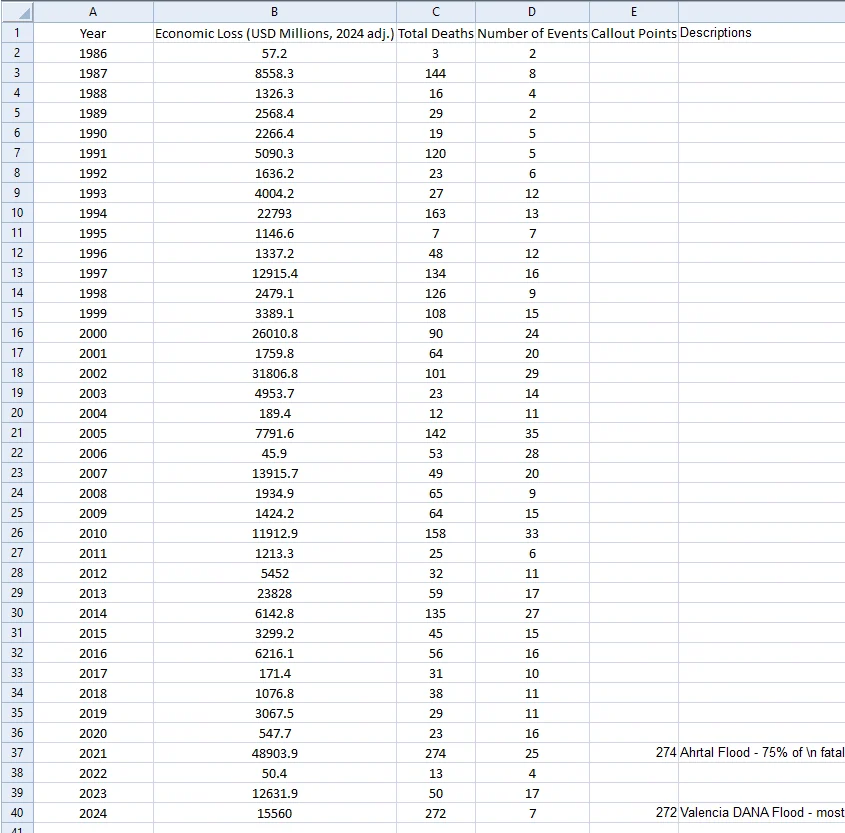
The data for this template can be found below which you can download and adjust using your own data:
Industry Focus: Climate Science, Meteorology, Environmental Science, Hydrology, Water Management, Economics, Risk Analysis
Graph Features: Bar, Line, Scatter
Compatibility: for the best experience, use this template in Grapher version 26.3 and up.
Instructions
To use this template in Grapher:
- For the best experience, structure your data in the same format shown on this page or use the example files if provided above.
- Click Download Template at the top of this page to download a GRT template file.
- In Grapher, click File | Open and open the file.
- Click Template | Populate Template to load your own data into the template.
Primary Categories: Comparison, Relational, Temporal
Industry Focuses: Climate Science, Economics, Environmental Science, Hydrology, Meteorology, Risk Analysis, Water Management
Type: Bar, Line, Scatter