Feature Classed Tadpole Plot
Grapher Template by Golden Software
173
519
Feature Classed Tadpole Plot
(Template by Golden Software).grt
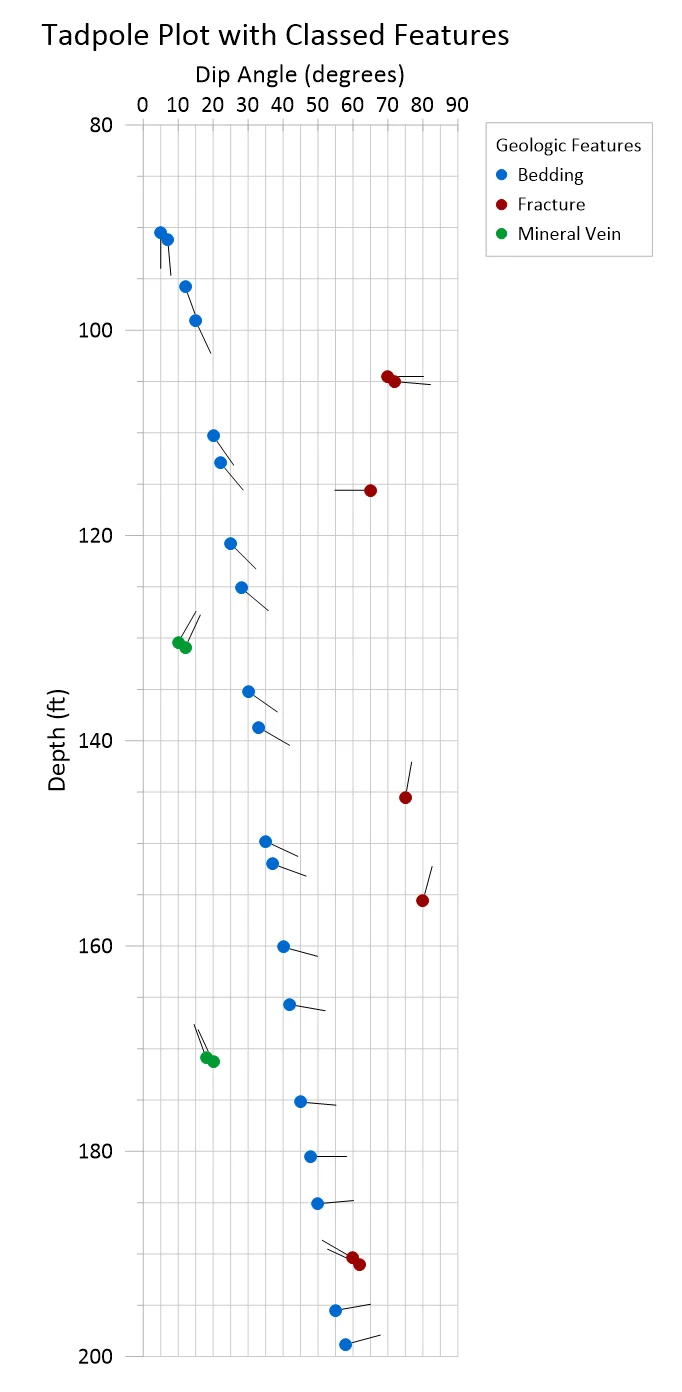
This template visualizes the orientation of planar geologic features such as bedding, fractures, and mineral veins, using a tadpole plot, where circular markers represent dip angle and tails show dip azimuth. Feature classes are color-coded to make structural patterns easy to interpret along depth.
Tadpole plots are widely used in structural geology, geotechnical logging, mining, and hydrogeology to identify fracture sets, bedding trends, or mineralized zones. The Magnitude column controls the tadpole tail length, defining the scale of each dip azimuth line. All feature classes, symbols, and labels can be quickly customized or toggled in the Object Manager to tailor the figure for specific datasets or reports.
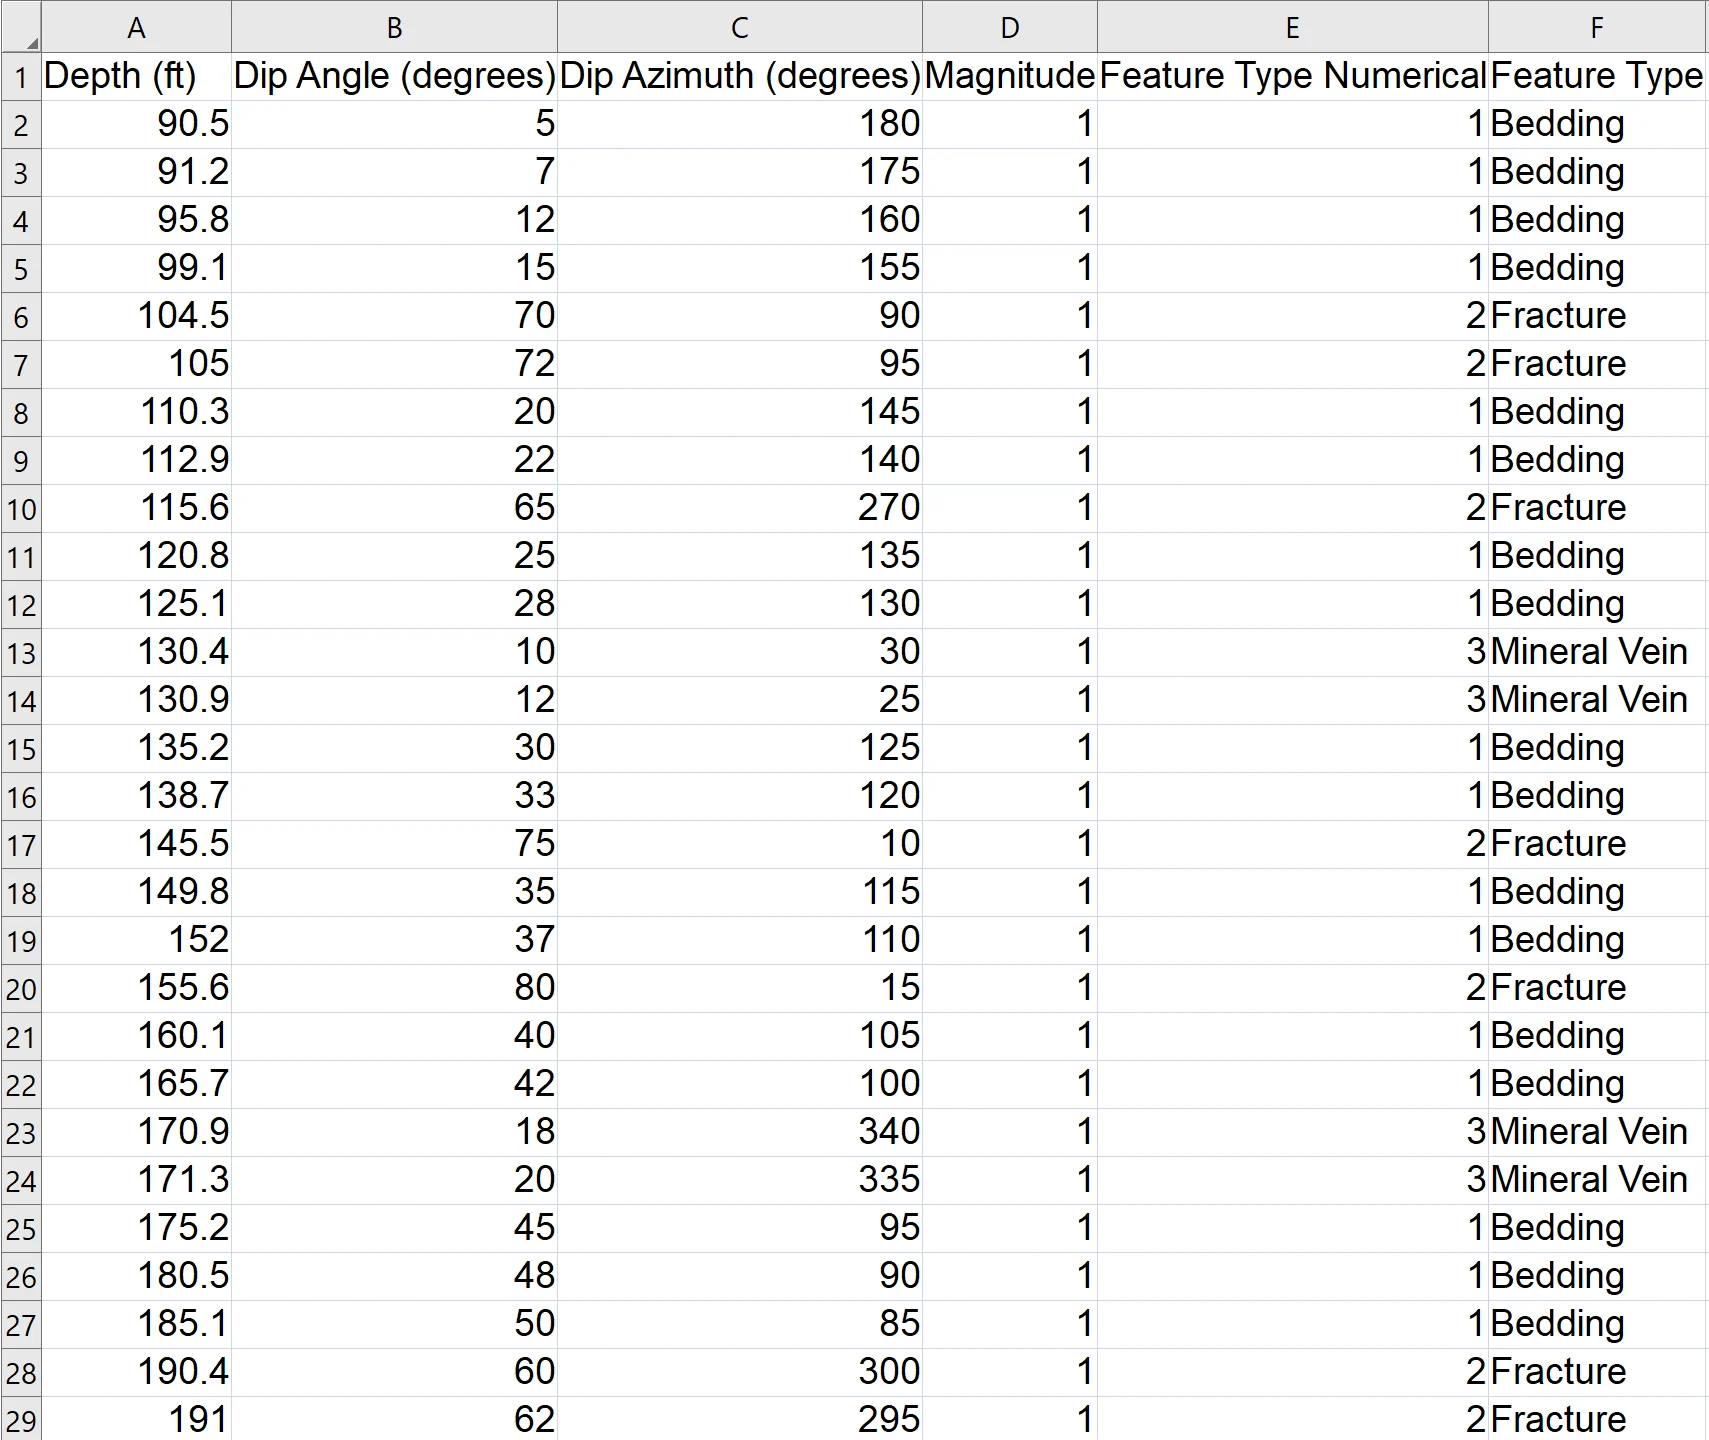
The data for this template can be found below which you can download and adjust using your own data:
Industry Focus: Environmental Science, Geology, Geophysics, Geotechnical Engineering, Hydrogeology, Hydrology, Mining, Oil and Gas
Graph Features: Class, Scatter, Vector
Instructions
To use this template in Grapher:
- For the best experience, structure your data in the same format shown on this page or use the example files if provided above.
- Click Download Template at the top of this page to download a GRT template file.
- In Grapher, click File | Open and open the file.
- Click Template | Populate Template to load your own data into the template.
Primary Categories: Categorical, Comparison, Relational, Spatial
Industry Focuses: Environmental Science, Geology, Geophysics, Geotechnical Engineering, Hydrogeology, Hydrology, Mining, Oil and Gas
Type: Class, Scatter, Vector