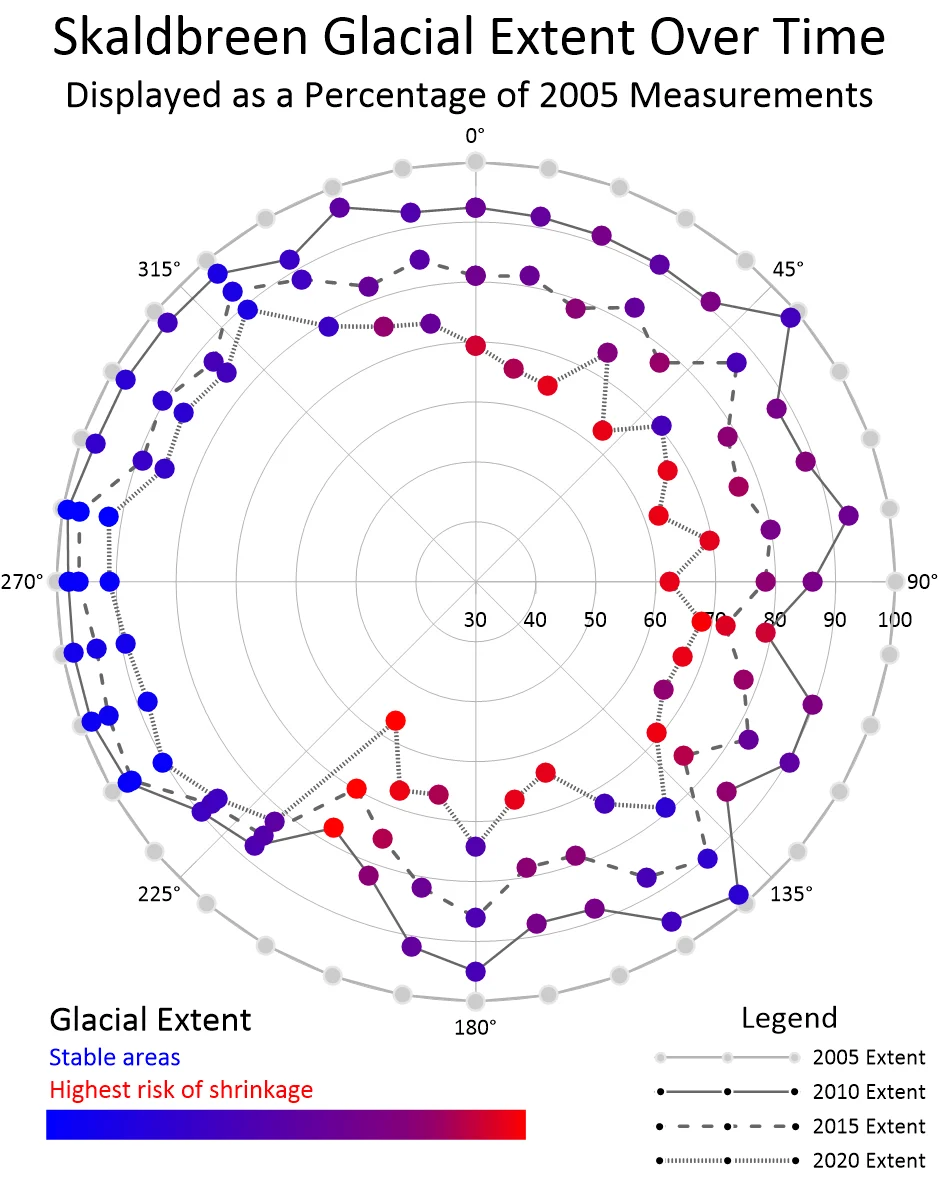
Glacial Extents Over Time
Grapher Template by Golden Software
136
541
Glacial Extents Over Time
(Template by Golden Software).grt
Polar line & scatter plot displaying changes in radial extent over time, using multiple datasets to show progression, stability, and variation. This visualization is used to track trends in phenomena that expand or contract in a circular pattern, such as environmental shifts, structural deformations, or movement patterns. The combination of lines and scatter points helps highlight key changes, while color gradients can be used to indicate risk zones, density, or intensity variations. Common applications include glacial retreat analysis, atmospheric studies, wave propagation, and mechanical stress testing.
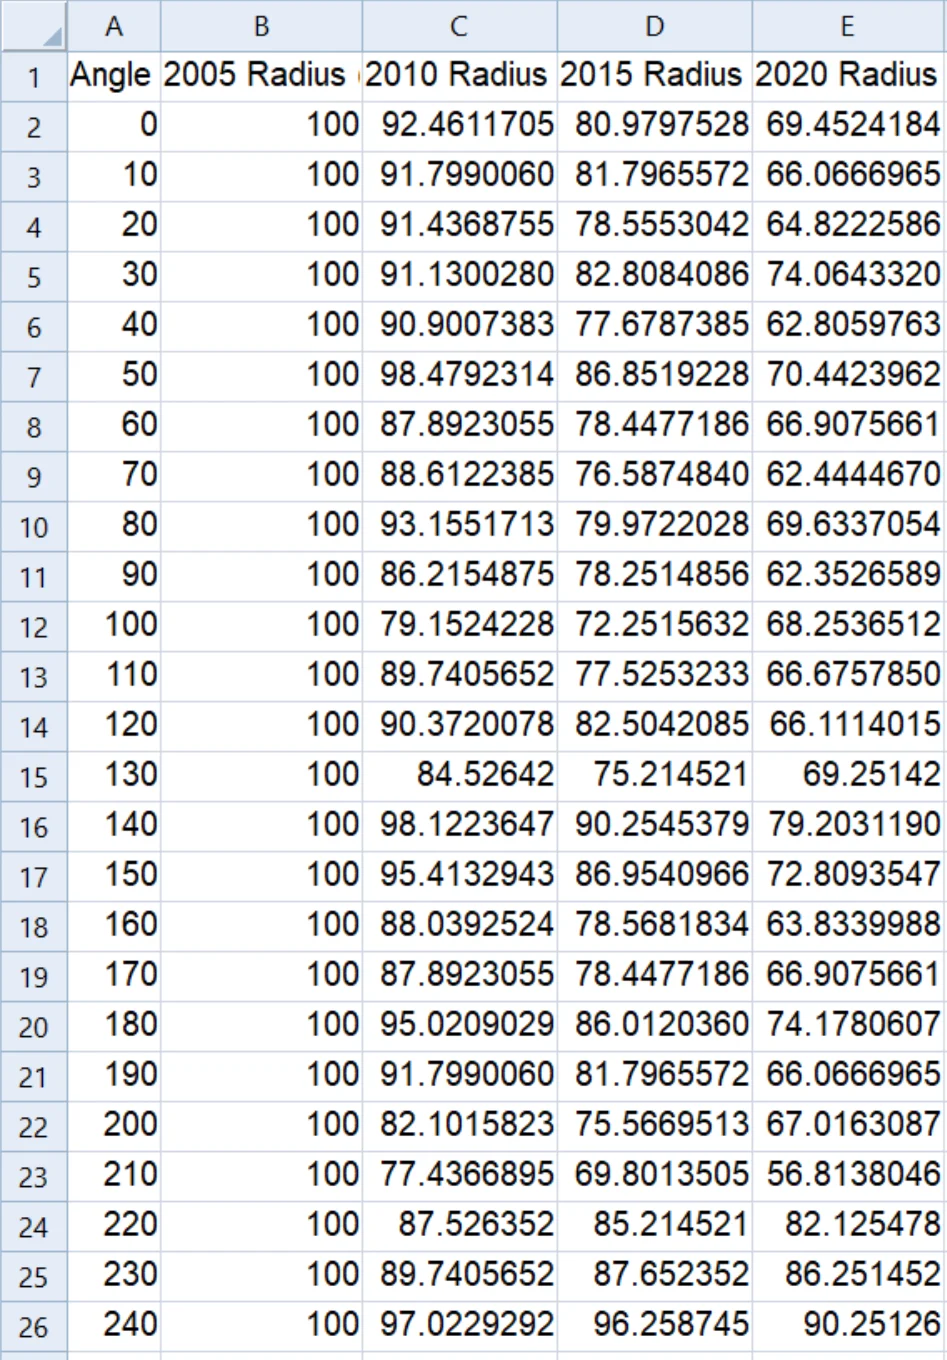
The data for this template can be found below which you can download and adjust using your own data:
Industry Focus: Aerospace, Climate Science, Engineering, Geoscience, Meteorology, Oceanography, Physics
Graph Features: Colormap, Polar
Instructions
To use this template in Grapher:
- For the best experience, structure your data in the same format shown on this page or use the example files if provided above.
- Click Download Template at the top of this page to download a GRT template file.
- In Grapher, click File | Open and open the file.
- Click Template | Populate Template to load your own data into the template.
Primary Categories: Comparison, Temporal
Industry Focuses: Aerospace, Climate Science, Engineering, Geoscience, Meteorology, Oceanography, Physics
Type: Colormap, Polar