Grade Distribution Histogram
Grapher Template by Golden Software
150
448
Grade Distribution Histogram
(Template by Golden Software).grt
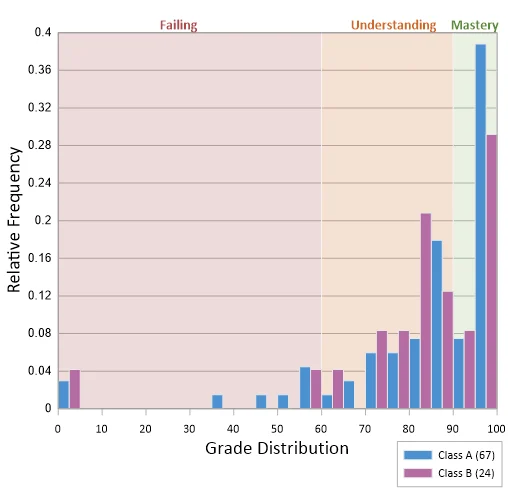
This histogram example uses relative frequencies to compare two different-sized distributions. This setup is useful when the sample size of the data sets varies, but you still want to compare the distribution overall. A common use case for this histogram example is classes with different numbers of students. With this comparison, we can answer questions like ‘What percentage of students scored in the Mastery range?’ or ‘What fraction of students are failing?’ The visualization showing the classes adjacent makes it clear, so we can compare how the students are performing against each other.
This kind of graph can also help compare daily water quality index values across two monitoring sites, river discharge frequencies categorized by hydrologic stage, and frequency of wind speed classes across two stations or seasons, just to name a few.
Finishing touches: Display a sample count in your legend for added context by simply changing the titles of the histograms to include a sample count like “Class A” -> “Class A (50)”.
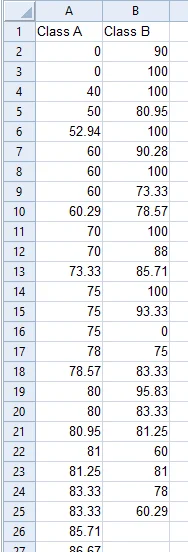
The data for this template can be found below which you can download and adjust using your own data:
Industry Focus: Education, Research, Manufacturing, Healthcare, Agriculture, Environmental Science, Finance, Data Science, Climate Science, Meteorology, Hydrology, Water Management, Geotechnical Engineering, and Civil Engineering
Graph Features: Histogram
Instructions
To use this template in Grapher:
- For the best experience, structure your data in the same format shown on this page or use the example files if provided above.
- Click Download Template at the top of this page to download a GRT template file.
- In Grapher, click File | Open and open the file.
- Click Template | Populate Template to load your own data into the template.
Primary Categories: Comparison, Distributive, Relational, Statistical
Industry Focuses: Agriculture, Civil Engineering, Climate Science, Data Science, Education, Environmental Science, Finance, Geotechnical Engineering, Healthcare, Hydrology, Manufacturing, Meteorology, Research, Water Management
Type: Histogram