Hydrograph
Grapher Template by Golden Software
267
569
Hydrograph
(Template by Golden Software).grt
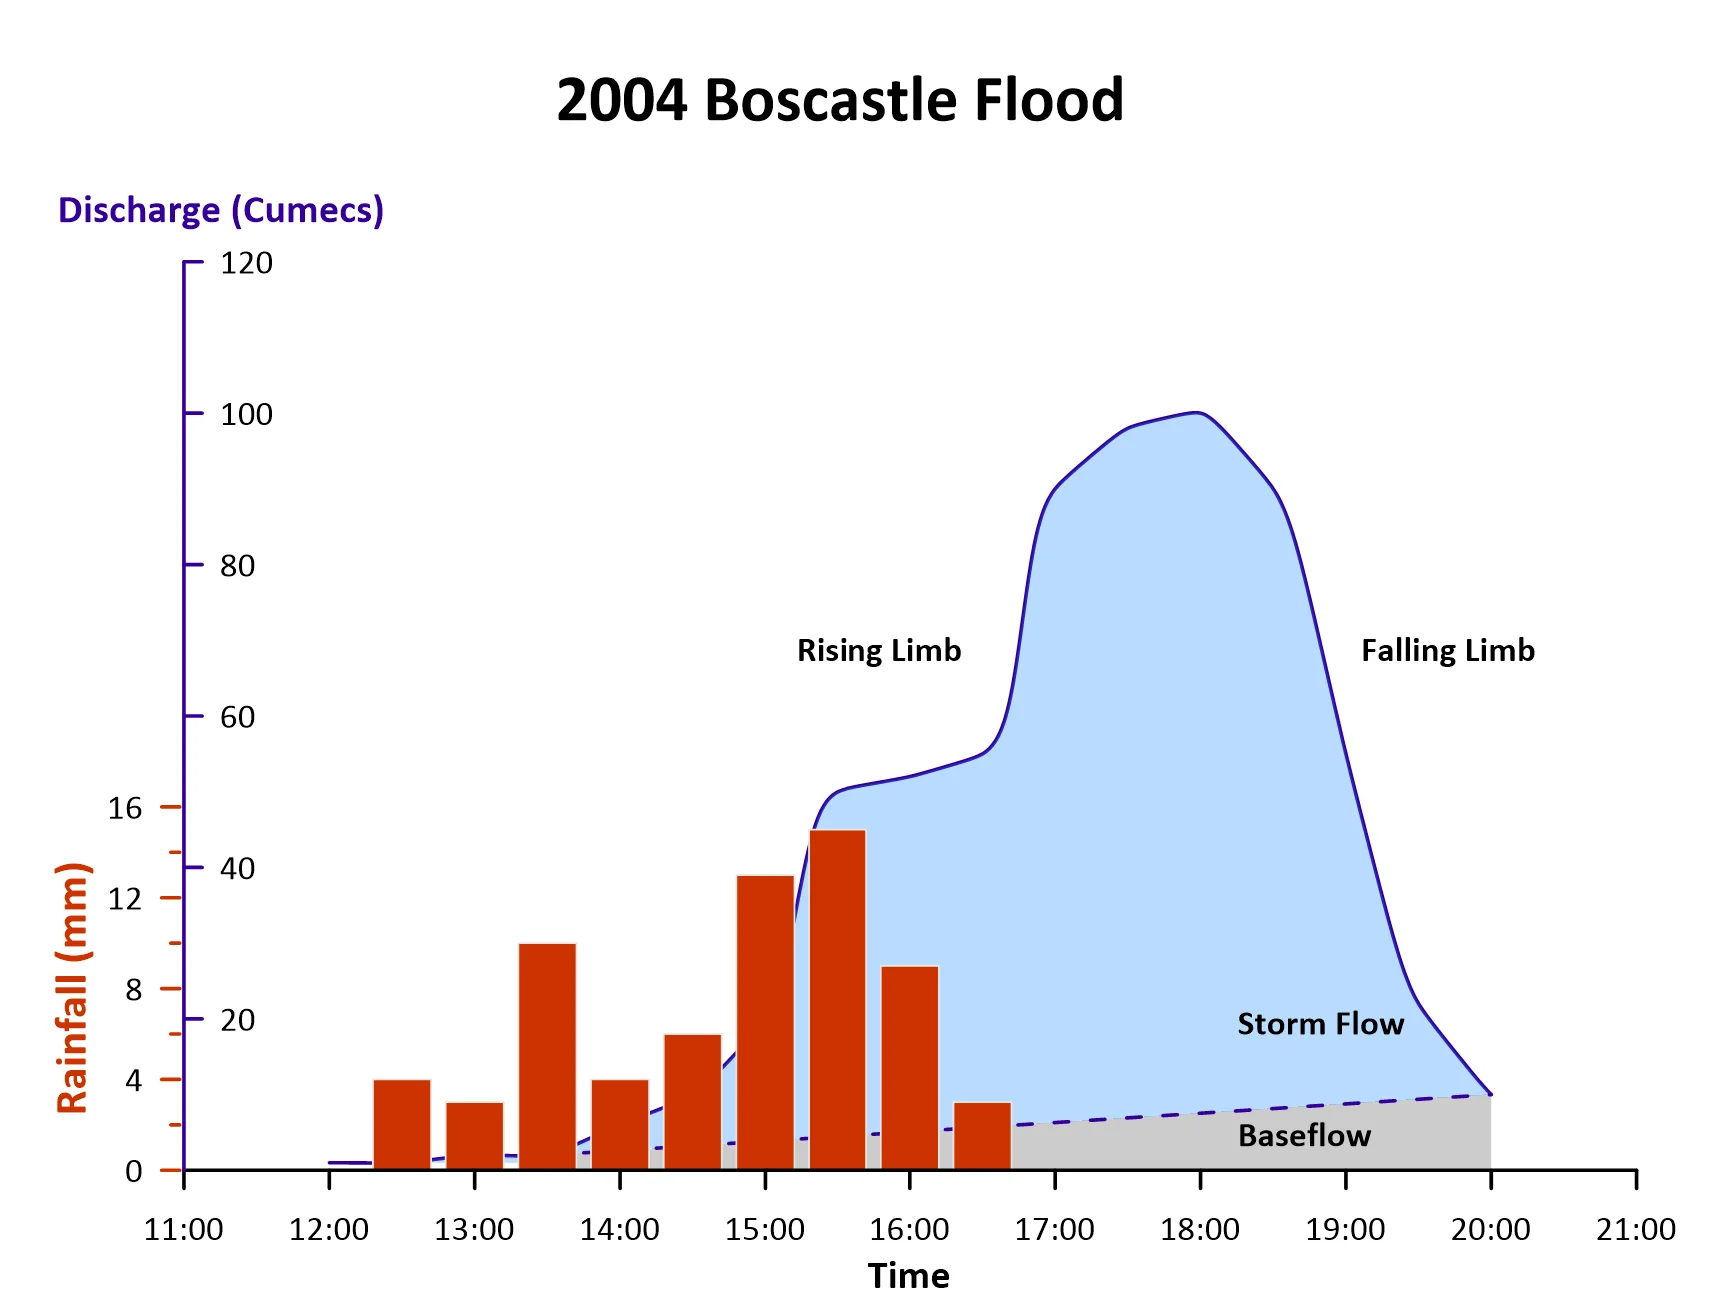
This hydrograph shows how rainfall (top bars) and stream discharge (bottom area) changed over the course of the Boscastle flood event in 2004. The combination of both datasets on one chart makes it easy to see how rainfall influenced streamflow over time, helping identify patterns like peak discharge and runoff delay.
This format is commonly used in hydrology, but it’s also great for any situation where one event triggers a response over time – like traffic flow after a concert, or energy use during a heatwave.
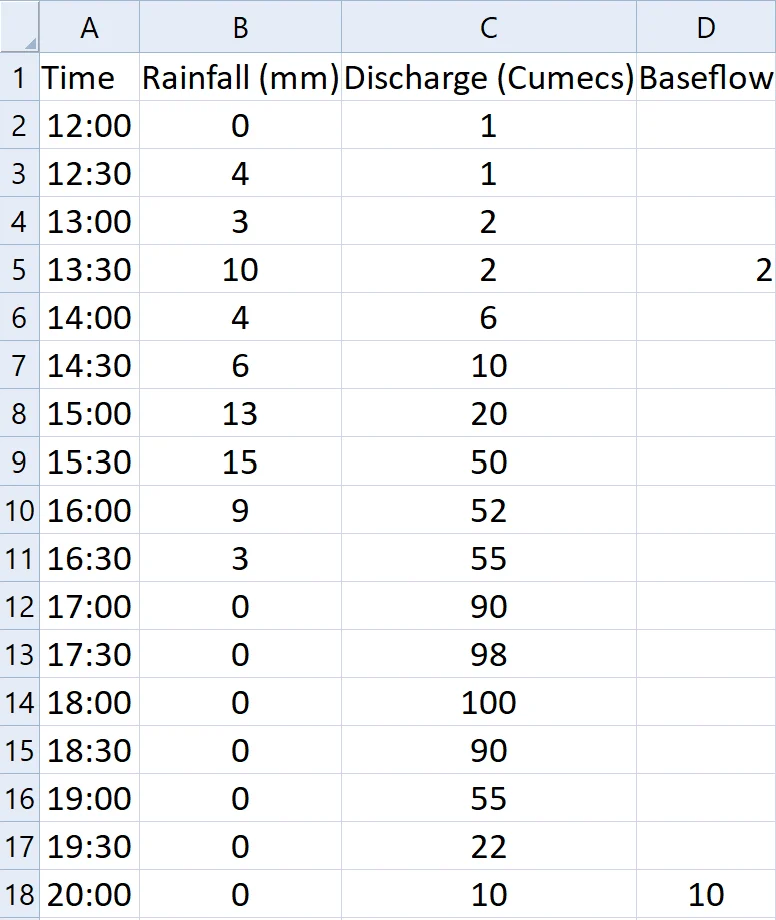
The data for this template can be found below which you can download and adjust using your own data:
Industry Focus: Civil Engineering, Hydrogeology, Hydrology, Water Management
Graph Features: Bar, Line
Instructions
To use this template in Grapher:
- For the best experience, structure your data in the same format shown on this page or use the example files if provided above.
- Click Download Template at the top of this page to download a GRT template file.
- In Grapher, click File | Open and open the file.
- Click Template | Populate Template to load your own data into the template.
Primary Categories: Distributive, Relational, Temporal
Industry Focuses: Civil Engineering, Hydrogeology, Hydrology, Water Management
Type: Bar, Line