Profit Calculator
Grapher Template by Golden Software
161
497
Profit Calculator
(Template by Golden Software).grt
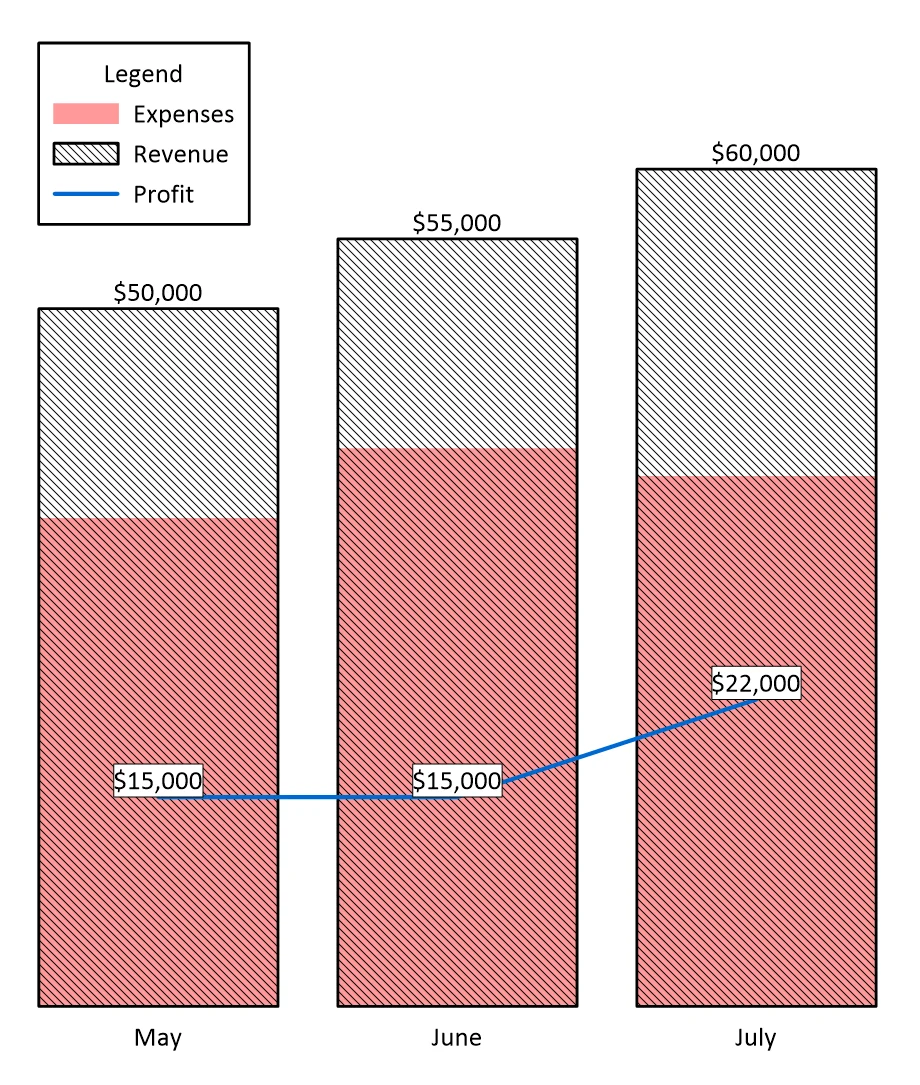
This template allows you to clearly visualize how your revenue and expenses stack up against each other by overlaying them in a bar chart display. Additionally, a profit value is automatically calculated on the plot based on the revenue and expense data to give extra insights to the profitability trend. This combined view highlights the relationship between income, costs, and net results to give a clear picture of financial health over time.
Charts like this are commonly used in accounting, business analysis, project management, and finance to quickly demonstrate profitability.
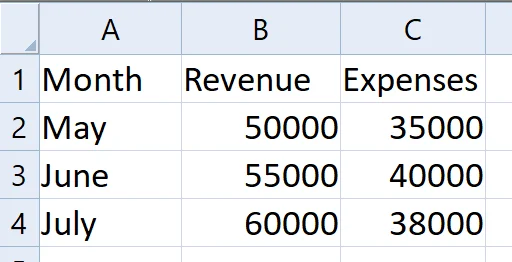
The data for this template can be found below which you can download and adjust using your own data:
Industry Focus: Asset Management, Business, Economics, Finance
Graph Features: Bar, Line, Math
Instructions
To use this template in Grapher:
- For the best experience, structure your data in the same format shown on this page or use the example files if provided above.
- Click Download Template at the top of this page to download a GRT template file.
- In Grapher, click File | Open and open the file.
- Click Template | Populate Template to load your own data into the template.
Primary Categories: Comparison, Distributive, Statistical, Temporal
Industry Focuses: Asset Management, Business, Economics, Finance
Type: Bar, Line, Math