Porosity vs Permeability
Grapher Template by Golden Software
163
548
Porosity vs Permeability
(Template by Golden Software).grt
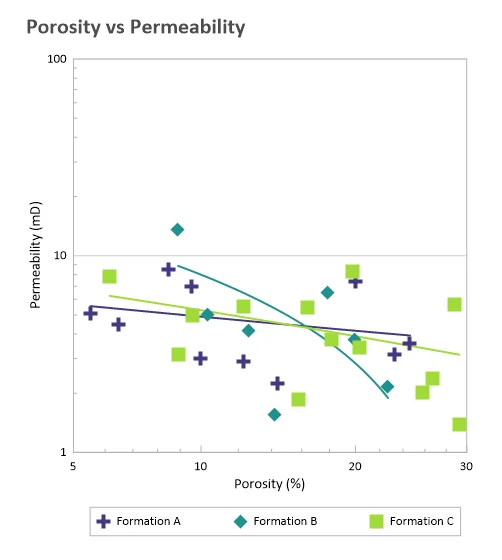
Porosity vs. permeability graphs are used to evaluate the quality of reservoir rocks by examining how easily fluids can flow through them. These plots help identify trends between storage capacity (porosity) and flow potential (permeability), which are critical for applications like groundwater modeling, hydrocarbon exploration, and CO₂ sequestration. They also assist in comparing different formations or lithologies to guide drilling and production decisions.
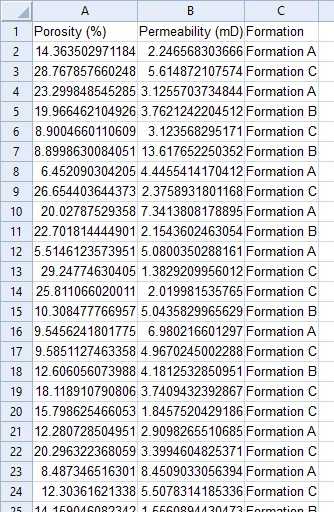
The data for this template can be found below which you can download and adjust using your own data:
Industry Focus: Hydrogeology, Geotechnical Engineering, Environmental Science
Graph Features: Class, Fit
Instructions
To use this template in Grapher:
- For the best experience, structure your data in the same format shown on this page or use the example files if provided above.
- Click Download Template at the top of this page to download a GRT template file.
- In Grapher, click File | Open and open the file.
- Click Template | Populate Template to load your own data into the template.
Primary Categories: Unknown
Industry Focuses: Environmental Science, Geotechnical Engineering, Hydrogeology
Type: Class, Fit