Price Changes
Grapher Template by Golden Software
145
520
Price Changes
(Template by Golden Software).grt
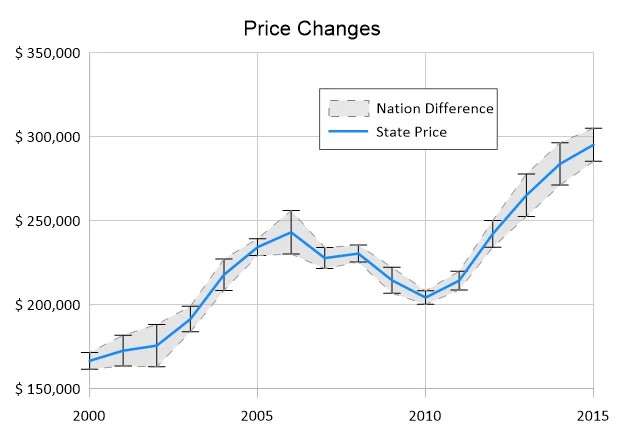
This is a Line Plot with Error Bars and a confidence band, used to compare a state’s average price over time (blue line) to national trends (gray dashed line with shaded area). The vertical error bars represent uncertainty or variation within the state data each year. This visualization clearly highlights both temporal trends and relative performance against a national benchmark.
This type of plot is ideal for comparing regional trends against broader national or international patterns — commonly used in real estate, economic analysis, policy research, and market studies. This chart shows a trend in price over time while also including a comparison to a price difference of a greater whole.
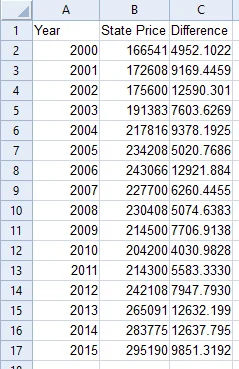
The data for this template can be found below which you can download and adjust using your own data:
Industry Focus: Agriculture
Graph Features: Error Bars, Line
Instructions
To use this template in Grapher:
- For the best experience, structure your data in the same format shown on this page or use the example files if provided above.
- Click Download Template at the top of this page to download a GRT template file.
- In Grapher, click File | Open and open the file.
- Click Template | Populate Template to load your own data into the template.
Primary Categories: Comparison, Temporal
Industry Focuses: Agriculture
Type: Error Bars, Line