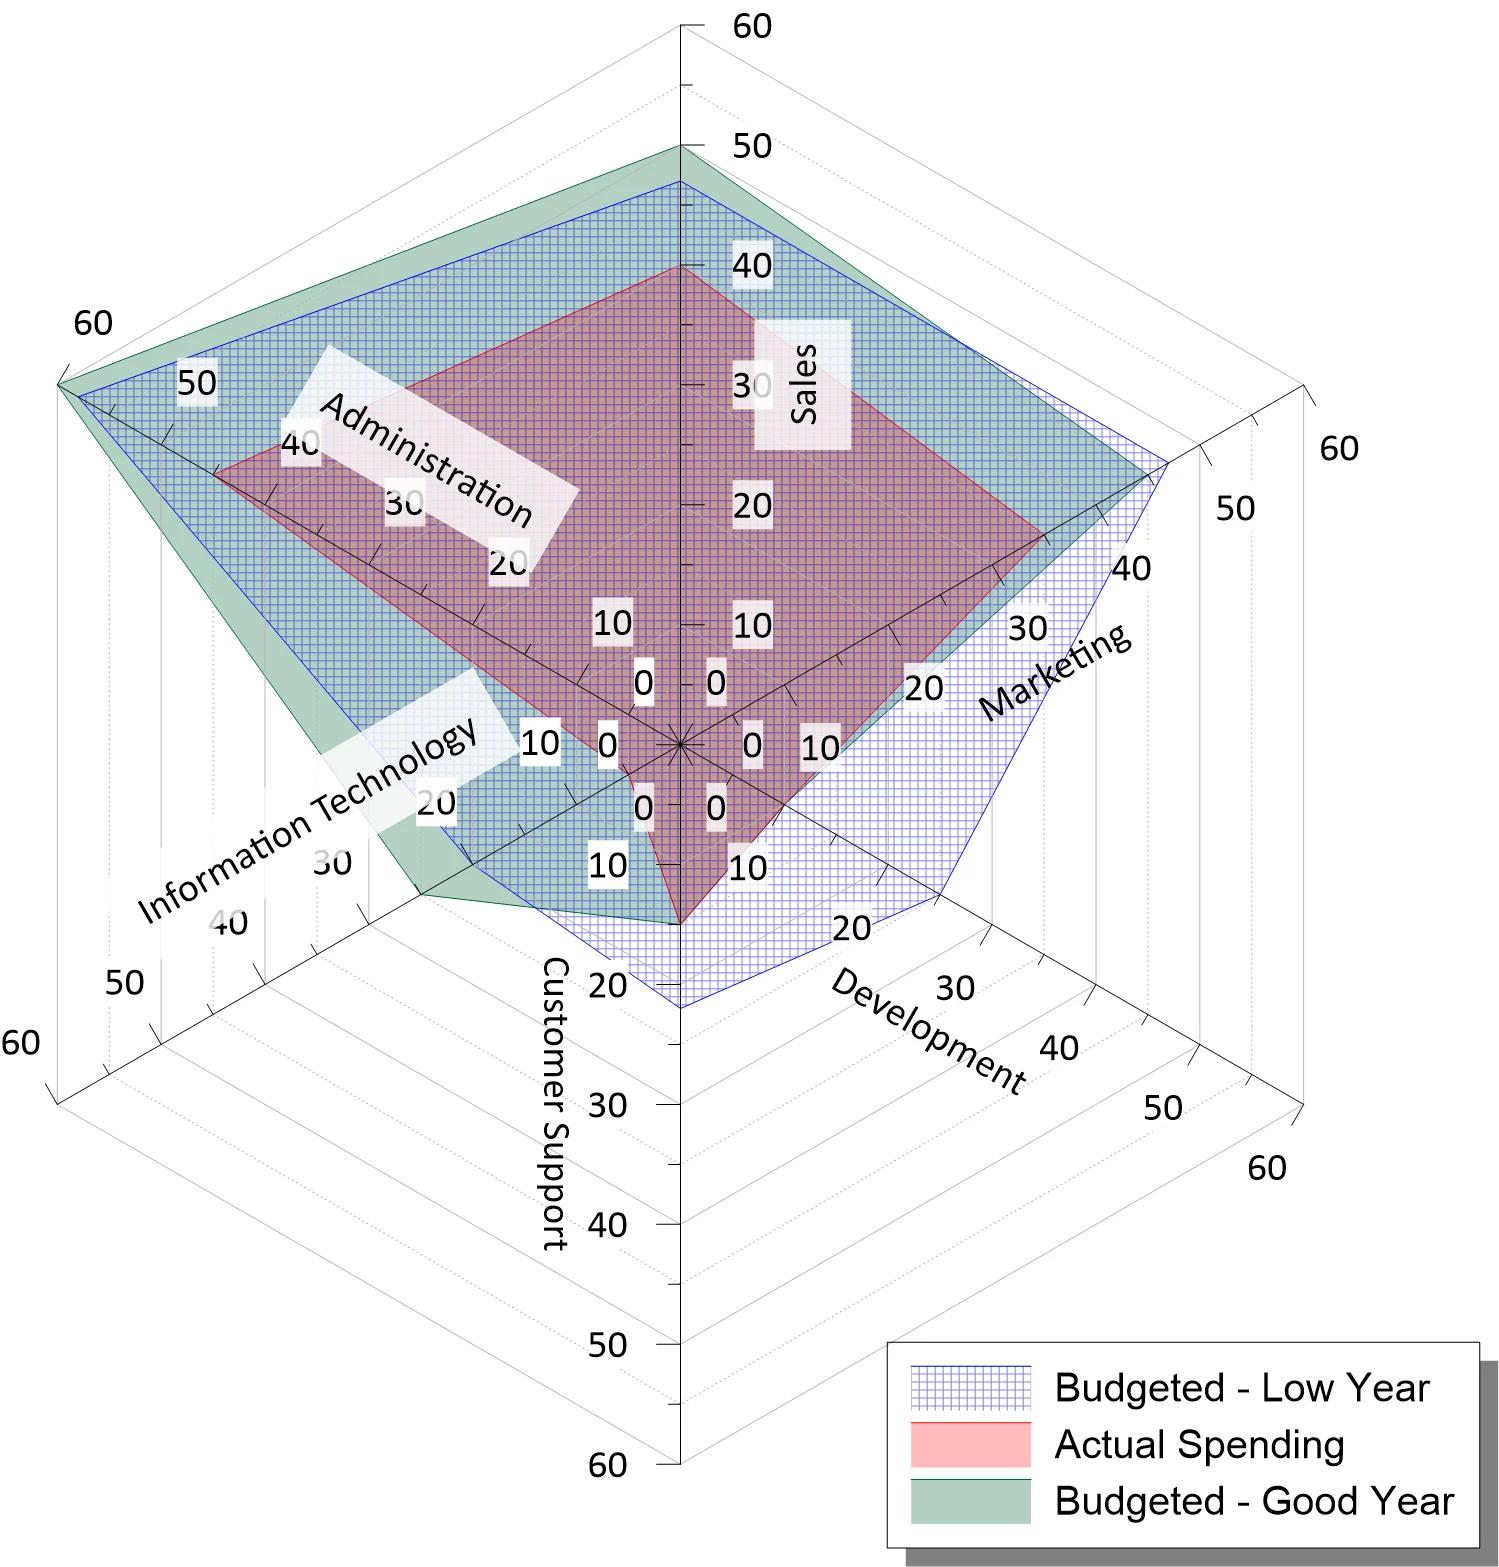
Radar Plot
Grapher Template by Golden Software
214
575
Radar Plot
(Template by Golden Software).grt
A Radar Plot, also known as a Spider Chart, is a radial graph commonly used to display multivariate data in a way that allows for easy comparison across multiple categories, and is particularly useful for performance analysis, decision-making, and visualizing strengths and weaknesses in various domains. This example visualizes budgeted vs. actual spending across multiple business departments, including Sales, Marketing, Development, Customer Support, IT, and Administration.
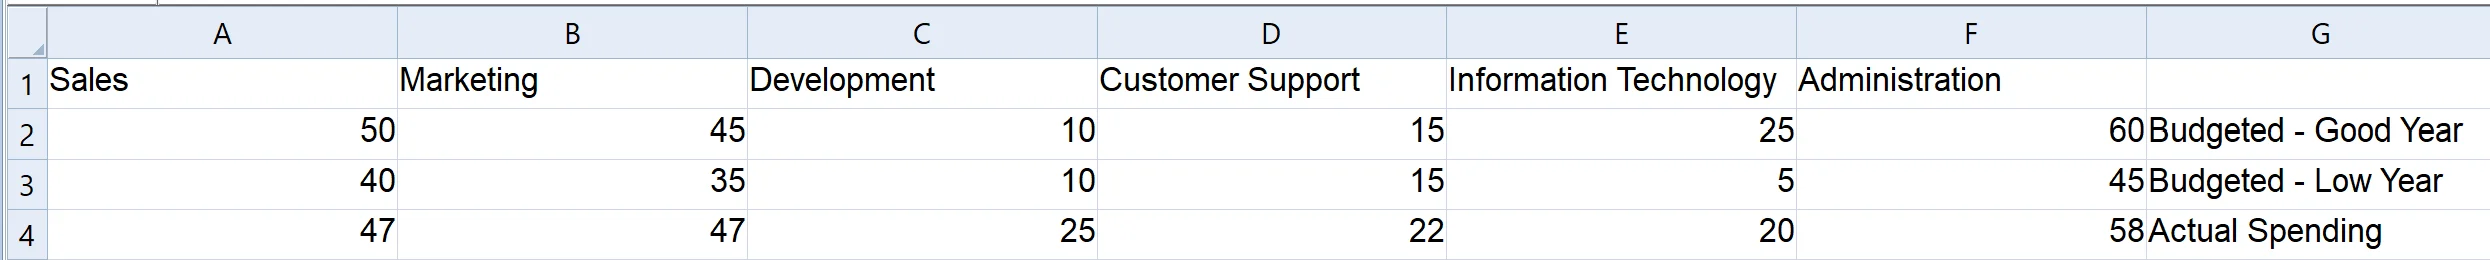
The data for this template can be found below which you can download and adjust using your own data:
Industry Focus: Business, Education, Engineering, Finance, Healthcare, IT, Manufacturing
Graph Features: Radar
Instructions
To use this template in Grapher:
- For the best experience, structure your data in the same format shown on this page or use the example files if provided above.
- Click Download Template at the top of this page to download a GRT template file.
- In Grapher, click File | Open and open the file.
- Click Template | Populate Template to load your own data into the template.
Primary Categories: Comparison, Multidimensional, Proportional
Industry Focuses: Business, Education, Engineering, Finance, Healthcare, IT, Manufacturing
Type: Radar