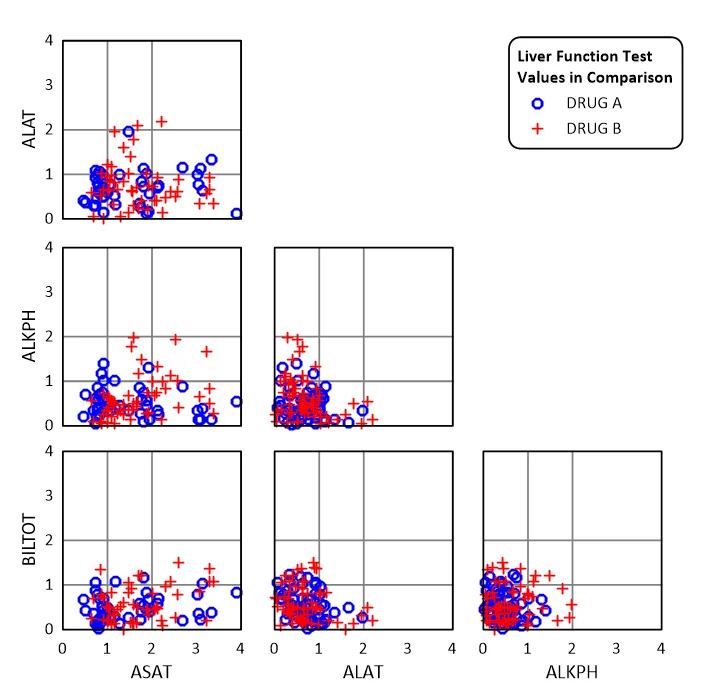
Scatter Plot Matrix
Grapher Template by Golden Software
216
556
Scatter Plot Matrix
(Template by Golden Software).grt
A scatter plot matrix can help visualize relationships between different variables compared against each other. A common use case is performing blood tests comparing substances made by your liver in reaction to different drugs. Attached is a template demonstrating a comparison of three substances reacting to two different drugs against each other: ALAT, ALKPH, and BILTOT.
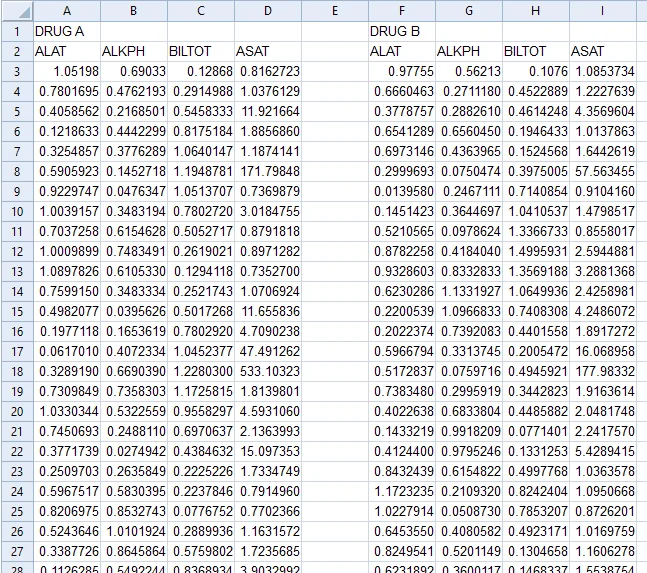
The data for this template can be found below which you can download and adjust using your own data:
Industry Focus: Chemistry, Environmental Science, Healthcare, Manufacturing, Marketing
Graph Features: Scatter
Instructions
To use this template in Grapher:
- For the best experience, structure your data in the same format shown on this page or use the example files if provided above.
- Click Download Template at the top of this page to download a GRT template file.
- In Grapher, click File | Open and open the file.
- Click Template | Populate Template to load your own data into the template.
Primary Categories: Comparison, Distributive, Multidimensional, Relational
Industry Focuses: Chemistry, Environmental Science, Healthcare, Manufacturing, Marketing
Type: Scatter