Snow Accumulation
Grapher Template by Golden Software
183
525
Snow Accumulation
(Template by Golden Software).grt
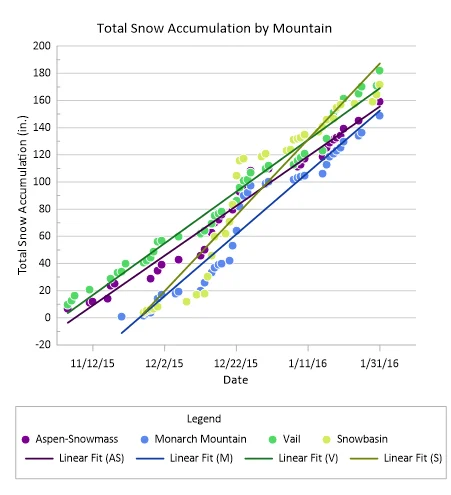
This scatter plot uses linear fit lines to compare total snow accumulation over time at four different mountain locations. Each group of colored points represents daily cumulative snow measurements for one location, while the corresponding trend lines (linear fits) show the overall rate of accumulation for each site during the winter season.
This type of plot is useful for visualizing trends across multiple categories or locations in a shared time series. Beyond snowfall data, it can be used for any context for a comparison of how different groups progress over time — such as sales growth by region, pollutant accumulation by monitoring station, or patient recovery metrics across hospitals. The combination of raw data and trend lines helps viewers interpret both short-term variability and long-term direction.
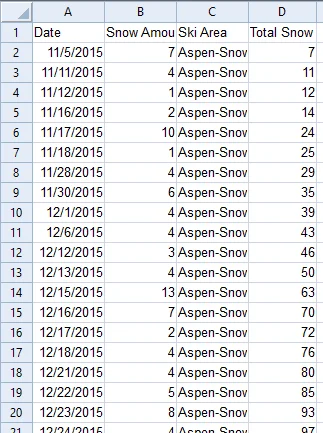
The data for this template can be found below which you can download and adjust using your own data:
Industry Focus: Agriculture, Environmental Science
Graph Features: Fit, Scatter
Instructions
To use this template in Grapher:
- For the best experience, structure your data in the same format shown on this page or use the example files if provided above.
- Click Download Template at the top of this page to download a GRT template file.
- In Grapher, click File | Open and open the file.
- Click Template | Populate Template to load your own data into the template.
Primary Categories: Comparison, Temporal
Industry Focuses: Agriculture, Environmental Science
Type: Fit, Scatter