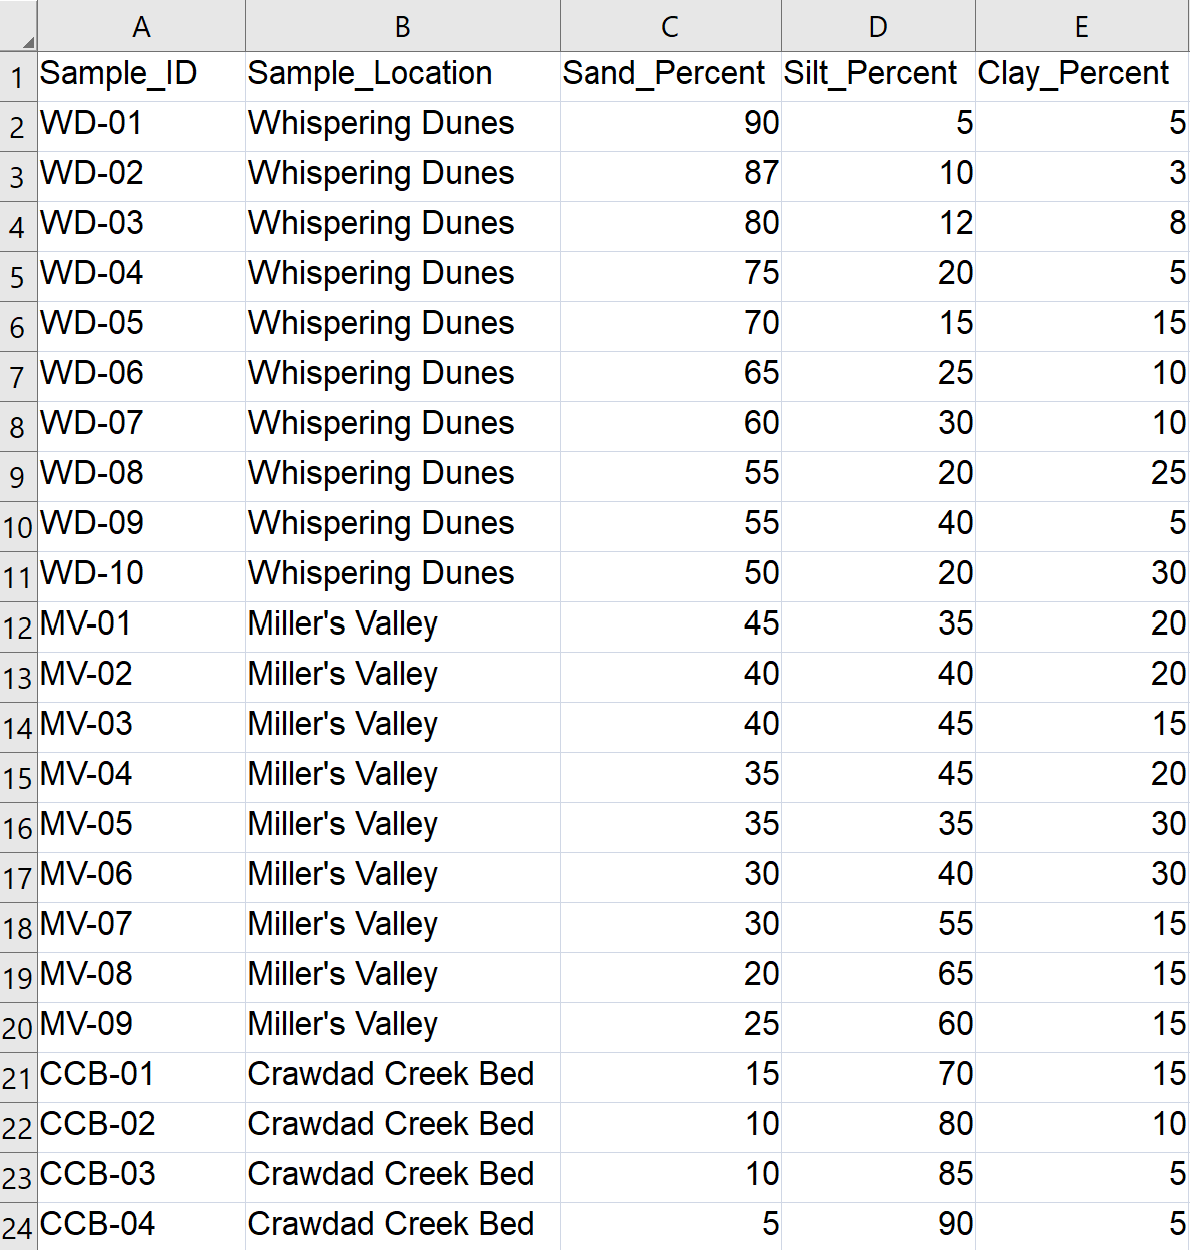
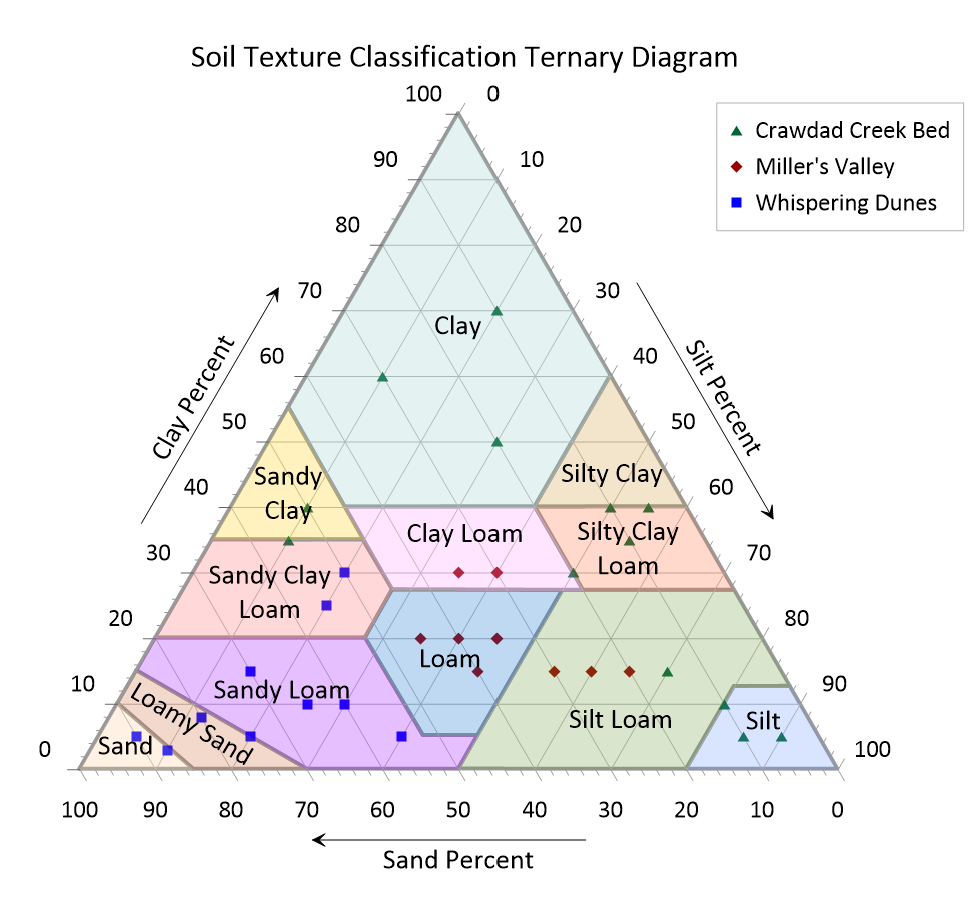
This template displays soil texture classifications on a ternary diagram, a trilinear graph where proportions of sand, silt, and clay are plotted as percentages that sum to 100%. The triangular grid is subdivided into USDA soil texture classes (e.g., Loam, Silty Clay Loam, Sandy Loam), making it straightforward to assign each sample to its corresponding texture type. Colored polygons and labeled segments highlight these predefined classes, while user data points are plotted with symbols and grouped by sampling location for easy comparison.
This template is designed for flexibility: the segment labels, colored class backgrounds, and bolded grey outline of the classification boundaries can be toggled on or off with a single click in the Object Manager, allowing users to quickly adjust the level of detail or presentation style for reports and publications.
Industry Focus: Environmental Science, Geology, Geotechnical Engineering, Soil Science
Graph Features: Class, Scatter, Ternary
Instructions
To use this template in Grapher:
- For the best experience, structure your data in the same format shown on this page or use the example files if provided above.
- Click Download Template at the top of this page to download a GRT template file.
- In Grapher, click File | Open and open the file.
- Click Template | Populate Template to load your own data into the template.
Data Layout

Primary Categories: Categorical, Comparison, Distributive
Industry Focuses: Environmental Science, Geology, Geotechnical Engineering
Type: Class, Scatter, Ternary
