Stacked Stiff Plots for Water Sample Analysis
Grapher Template by Golden Software
238
580
Stacked Stiff Plots for Water Sample Analysis
(Template by Golden Software).grt
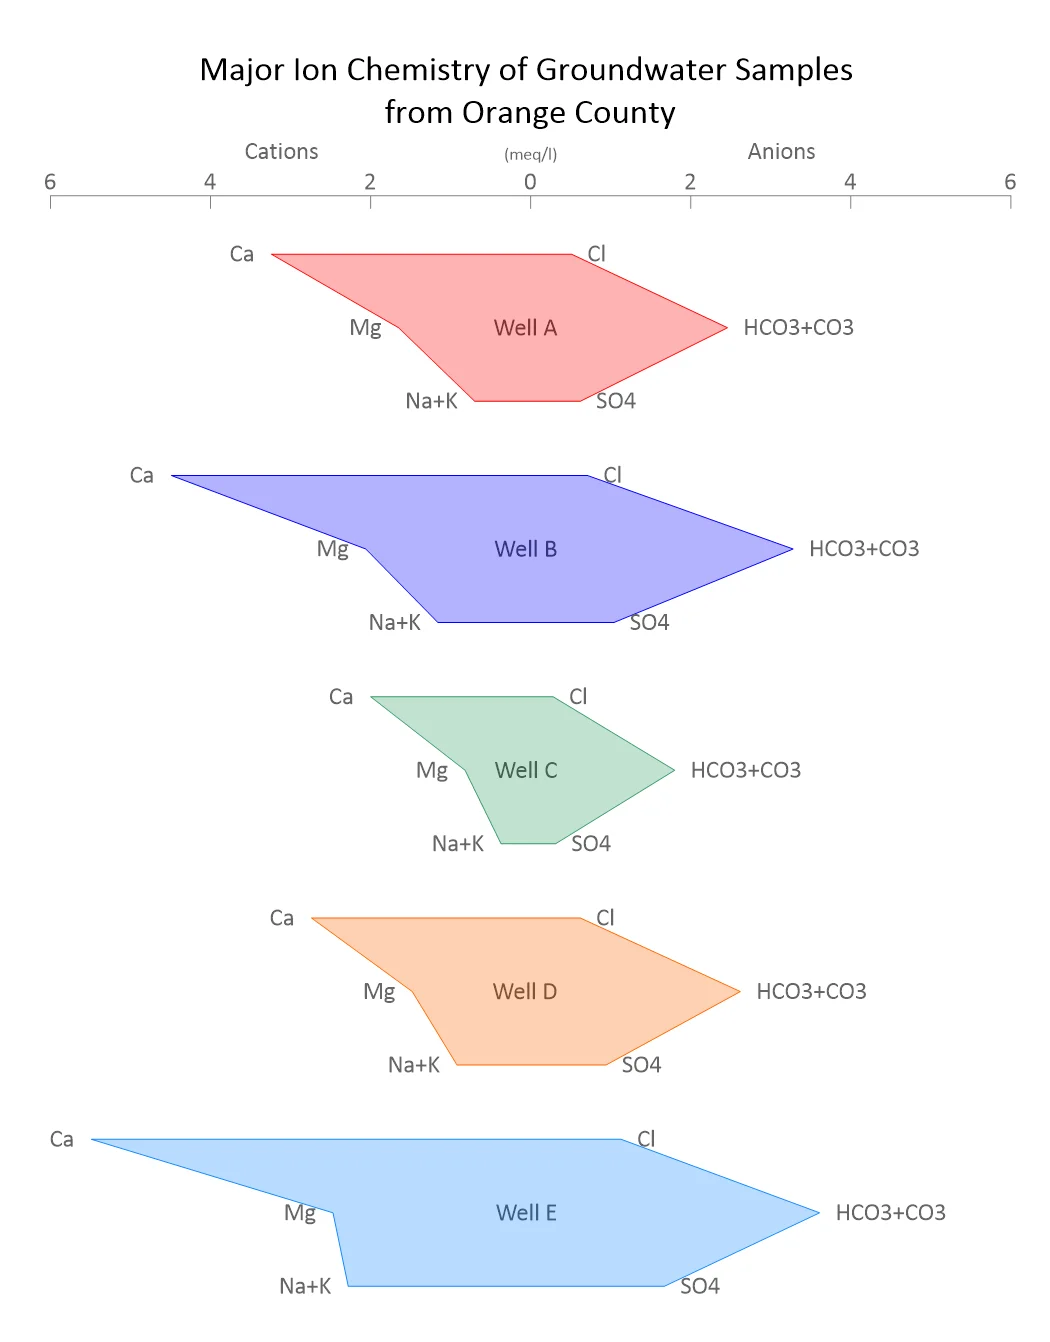
This template displays the major ion chemistry of groundwater samples using stacked Stiff diagrams. Each polygon represents the ionic balance of one sample, plotted with cations (Ca, Mg, Na+K) on the left and anions (Cl, SO₄, HCO₃+CO₃) on the right. The resulting shape acts like a “fingerprint” of that water sample’s chemical signature, making it straightforward to compare multiple wells, depths, or time intervals.
Stiff plots like this are widely used in hydrogeochemistry, hydrogeology, and environmental science to identify water types, track geochemical evolution, and evaluate processes such as recharge, mixing, or contamination. For example, stacked Stiff diagrams can quickly reveal seasonal variations in groundwater chemistry, distinguish aquifer facies, or compare field sites during remediation studies.
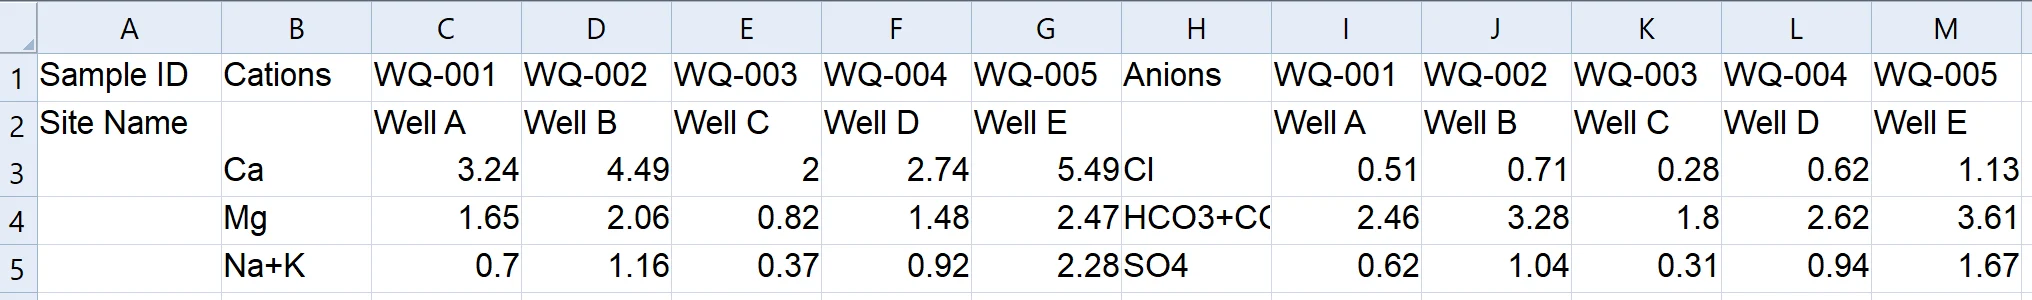
The template is pre-formatted for efficiency: each column corresponds to a sample, while cations and anions are organized by row. This structure makes it simple to reuse the template with different water chemistry datasets, even when the number of ions varies, and ensures consistent, publication-ready outputs for reports, regulatory submissions, or project deliverables.
The data for this template can be found below which you can download and adjust using your own data:
Industry Focus: Civil Engineering, Environmental Science, Geochemistry, Geology, Hydrogeochemistry, Hydrology, Hydrogeology, Water Quality Management, Water Resources, Water Treatment
Graph Features: Stiff
Instructions
To use this template in Grapher:
- For the best experience, structure your data in the same format shown on this page or use the example files if provided above.
- Click Download Template at the top of this page to download a GRT template file.
- In Grapher, click File | Open and open the file.
- Click Template | Populate Template to load your own data into the template.
Primary Categories: Comparison, Multidimensional
Industry Focuses: Civil Engineering, Environmental Science, Geochemistry, Geology, Hydrogeochemistry, Hydrogeology, Hydrology, Water Management, Water Resources, Water Treatment
Type: Stiff