Step Plot
Grapher Template by Golden Software
160
524
Step Plot
(Template by Golden Software).grt
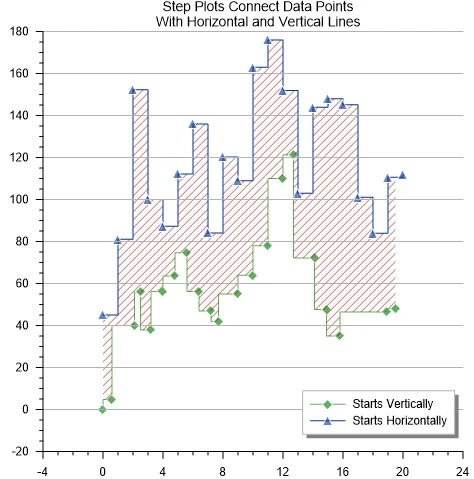
A Step Plot is a type of line plot where data points are connected by horizontal and vertical line segments instead of a continuous curve. This creates a staircase-like appearance, making it particularly useful for representing data that changes at specific intervals rather than continuously. Step plots are ideal for time series data with sudden jumps, such as stock prices, interest rates, or inventory levels. They clearly show points where values change, making them useful in control systems, signal processing, and pricing models. Step plots are especially valuable when working with categorical time-based data, piecewise constant signals, or when precise change points matter.
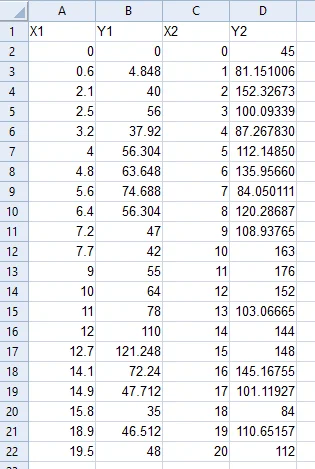
The data for this template can be found below which you can download and adjust using your own data:
Industry Focus: Data Science, Economics, Engineering, Environmental Science, Finance, Healthcare, Research, Telecommunications
Graph Features: Step
Instructions
To use this template in Grapher:
- For the best experience, structure your data in the same format shown on this page or use the example files if provided above.
- Click Download Template at the top of this page to download a GRT template file.
- In Grapher, click File | Open and open the file.
- Click Template | Populate Template to load your own data into the template.
Primary Categories: Relational, Spatial
Industry Focuses: Data Science, Economics, Engineering, Environmental Science, Finance, Healthcare, Research, Telecommunications
Type: Step