Stiff Frame
Grapher Template by Golden Software
184
579
Stiff Frame
(Template by Golden Software).grt
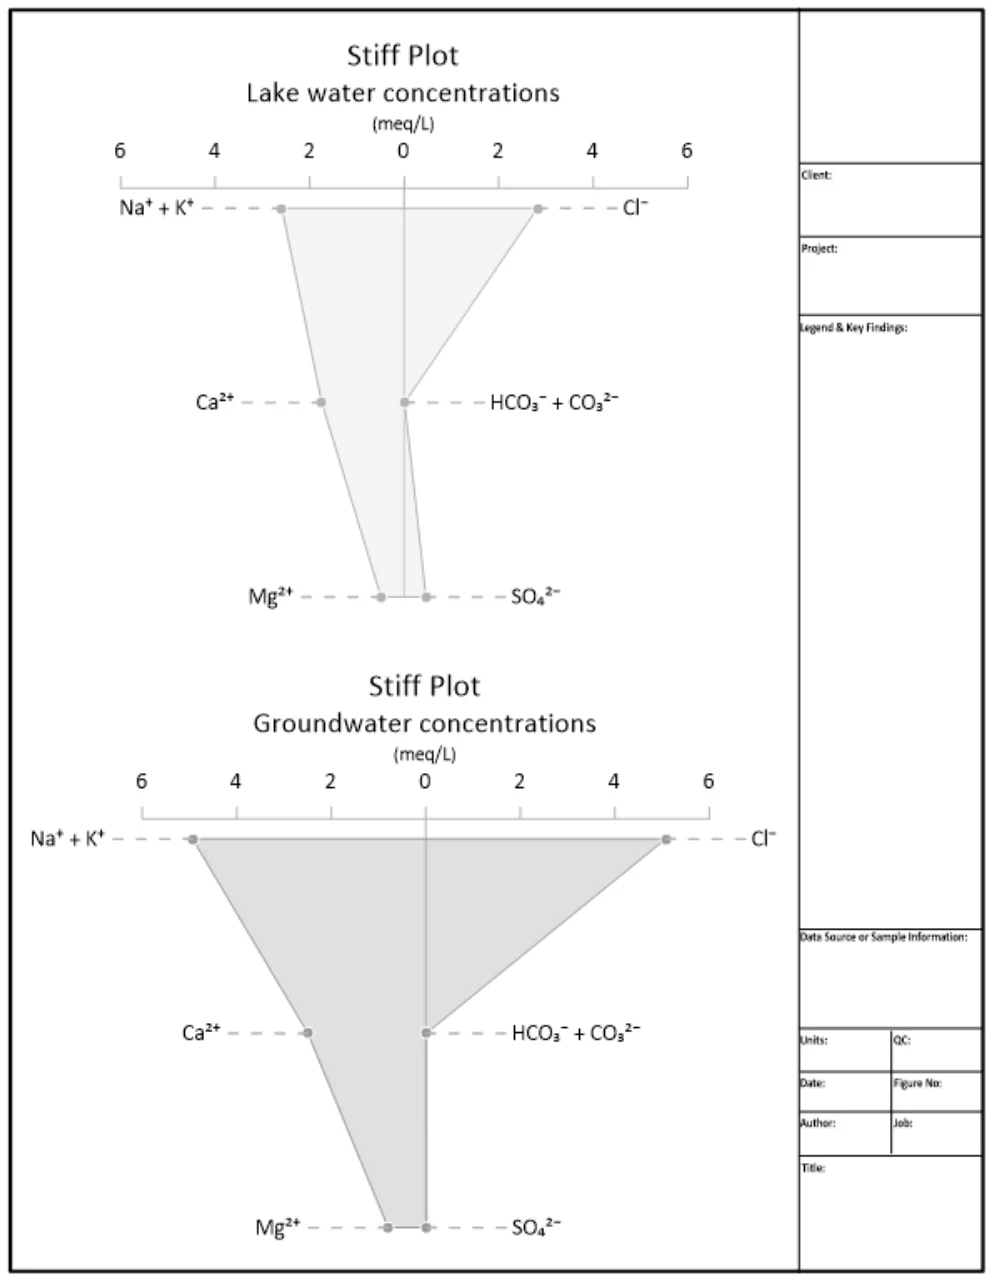
A Stiff plot, presented within a frame layout, visualizing the major ion composition, concentrations, or contaminant levels in water samples. Cations are represented on the left side, and anions on the right. The shape of the plot facilitates a rapid visual comparison of water chemistry, enabling the identification of distinct hydrochemical facies and potential trends across the study area. The frame layout incorporates company information, project details, sample locations, a legend, and other relevant metadata to ensure clear visualization of water chemistry variations.
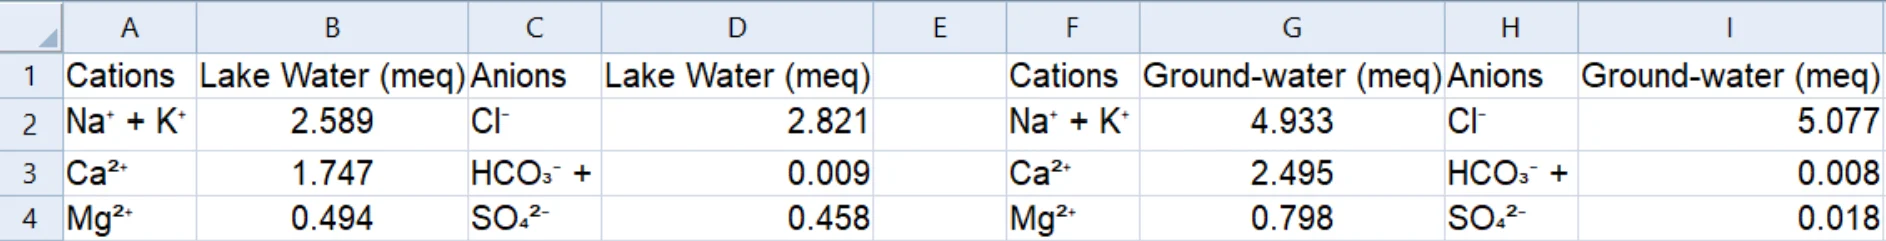
The data for this template can be found below which you can download and adjust using your own data:
Industry Focus: Environmental Science, Geochemistry, Hydrogeology, Mining, Oil and Gas, Water Treatment
Graph Features: Stiff
Instructions
To use this template in Grapher:
- For the best experience, structure your data in the same format shown on this page or use the example files if provided above.
- Click Download Template at the top of this page to download a GRT template file.
- In Grapher, click File | Open and open the file.
- Click Template | Populate Template to load your own data into the template.
Primary Categories: Comparison, Multidimensional, Proportional, Relational
Industry Focuses: Environmental Science, Geochemistry, Hydrogeology, Mining, Oil and Gas, Water Treatment
Type: Stiff