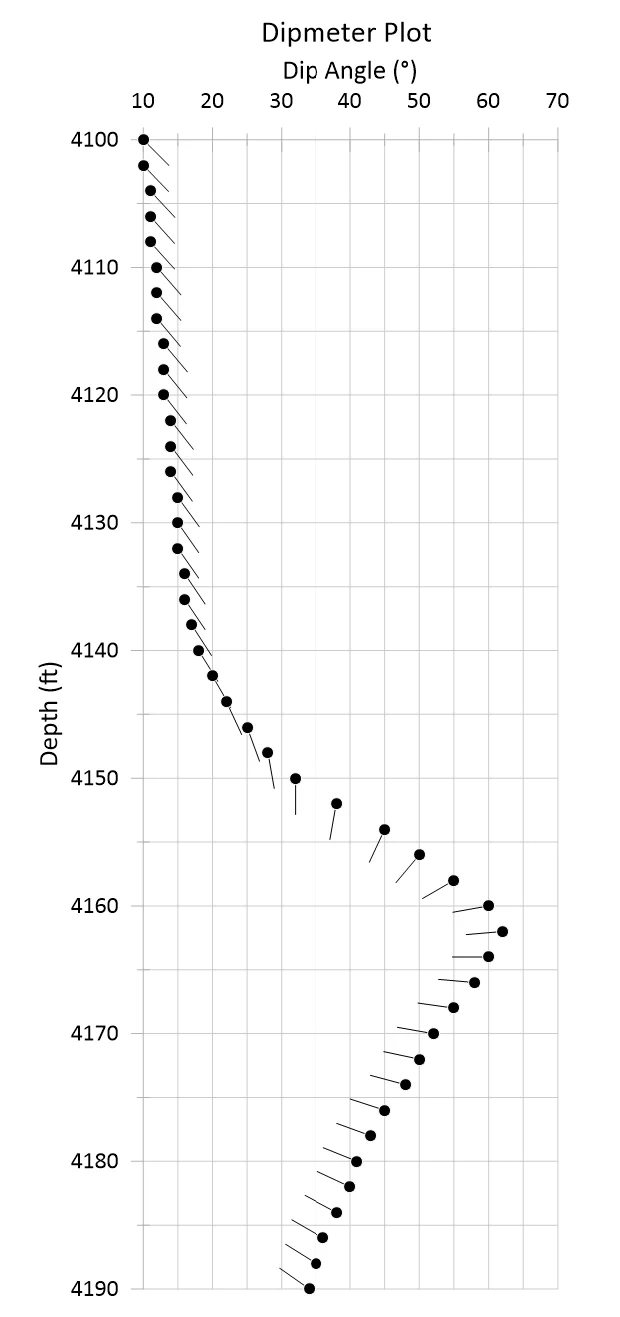
Tadpole Plot (Dipmeter Plot)
Grapher Template by Golden Software
216
534
Tadpole Plot (Dipmeter Plot)
(Template by Golden Software).grt
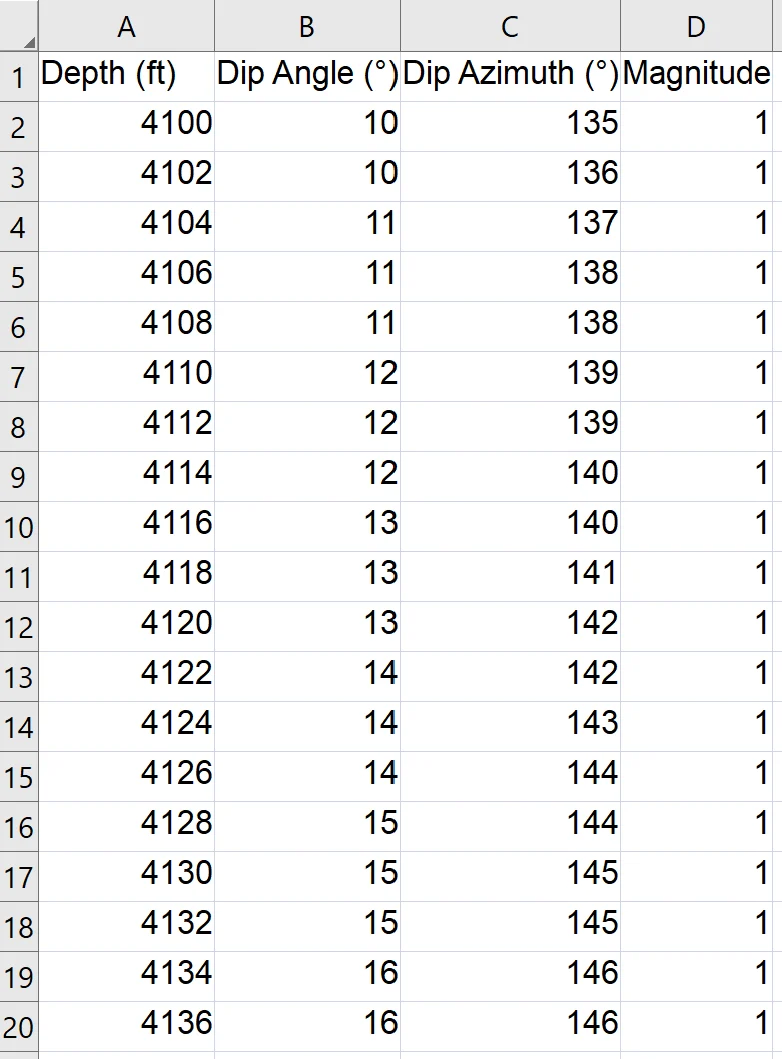
This template visualizes the dip and dip direction of planar features, such as bedding, foliation, or fractures, along a borehole or stratigraphic column. Each circle marks a dip measurement, with the attached tail indicating dip direction and length scaled by the Magnitude column.
Tadpole plots are widely used in structural geology, geotechnical engineering, and petroleum exploration to interpret folding, faulting, and bedding orientation directly from well or core data.
The data for this template can be found below which you can download and adjust using your own data:
Industry Focus: Geotechnical Engineering, Hydrology, Mining, Oil and Gas
Graph Features: Scatter, Vector
Instructions
To use this template in Grapher:
- For the best experience, structure your data in the same format shown on this page or use the example files if provided above.
- Click Download Template at the top of this page to download a GRT template file.
- In Grapher, click File | Open and open the file.
- Click Template | Populate Template to load your own data into the template.
Primary Categories: Relational, Spatial
Industry Focuses: Geotechnical Engineering, Hydrology, Mining, Oil and Gas
Type: Class, Vector