Wilcox Diagram
Grapher Template by Golden Software
336
644
Wilcox Diagram
(Template by Golden Software).grt
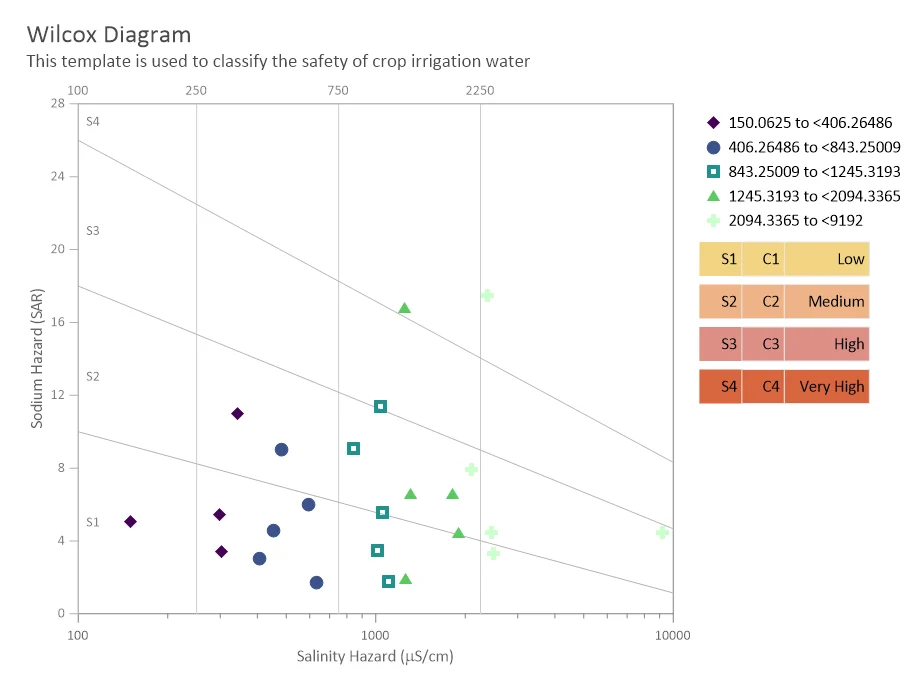
A Wilcox diagram is used to evaluate the suitability of water for agricultural irrigation by comparing salinity hazard (measured as electrical conductivity) with sodium hazard (measured as Sodium Adsorption Ratio, or SAR). Water samples are plotted within a matrix of zones that classify them from low to very high risk based on their potential impact on soil permeability and crop health. This makes the Wilcox diagram especially useful for guiding irrigation decisions in areas where water quality varies or salinity is a concern.
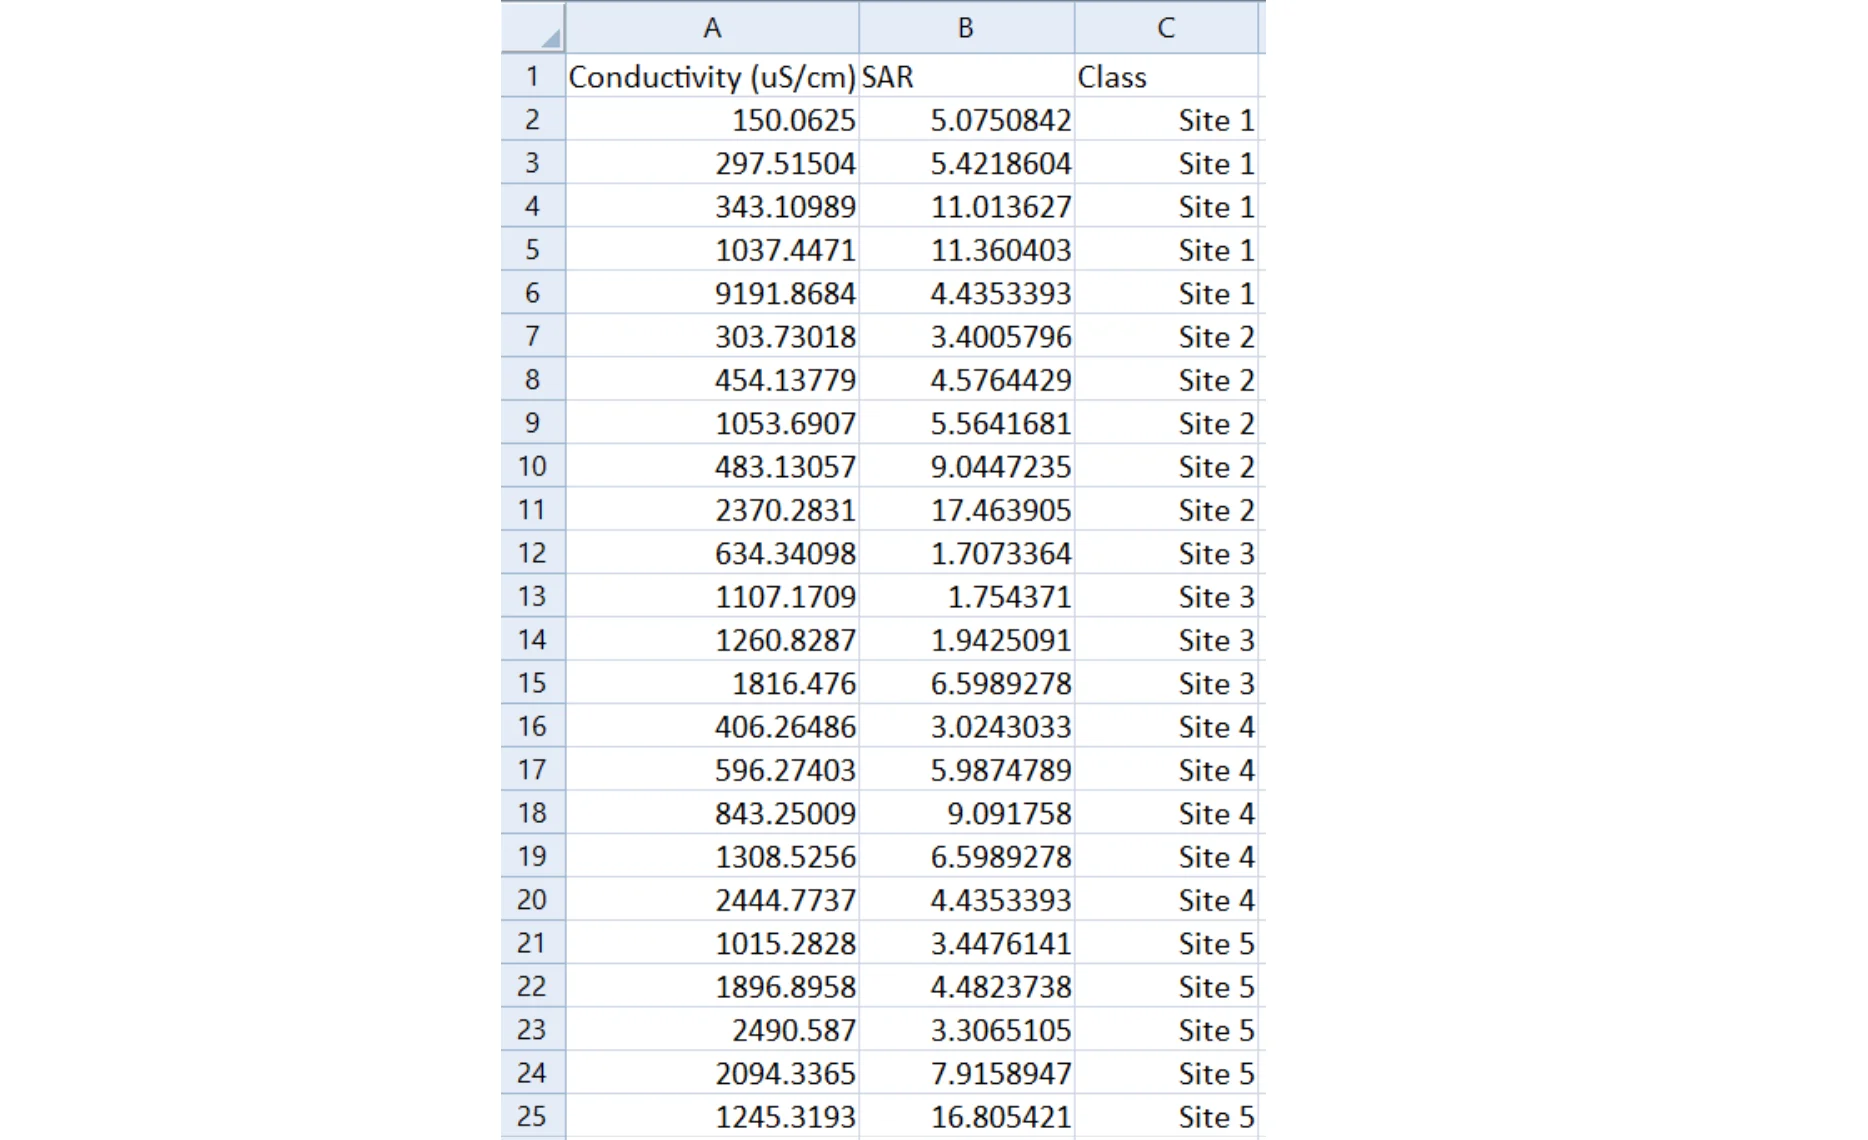
This template allows users to visualize multiple sample sites at once, with each point placed according to its SAR and EC values and grouped by location for comparison. The data sheet includes one row per sample, with columns for SAR, electrical conductivity, and site grouping, making it easy to adapt this plot to your own monitoring data.
For the best experience, use these Excel files for populating the template, replacing your own data in the WilcoxData.xlsx file:
Industry Focus: Agriculture, Engineering, Hydrology
Graph Features: Class, Line
Instructions
To use this template in Grapher:
- For the best experience, structure your data in the same format shown on this page or use the example files if provided above.
- Click Download Template at the top of this page to download a GRT template file.
- In Grapher, click File | Open and open the file.
- Click Template | Populate Template to load your own data into the template.
Primary Categories: Categorical, Relational
Industry Focuses: Agriculture, Engineering, Hydrology
Type: Class, Line