Wind Rose Diagram
Grapher Template by Golden Software
1461
907
Wind Rose Diagram
(Template by Golden Software).grt
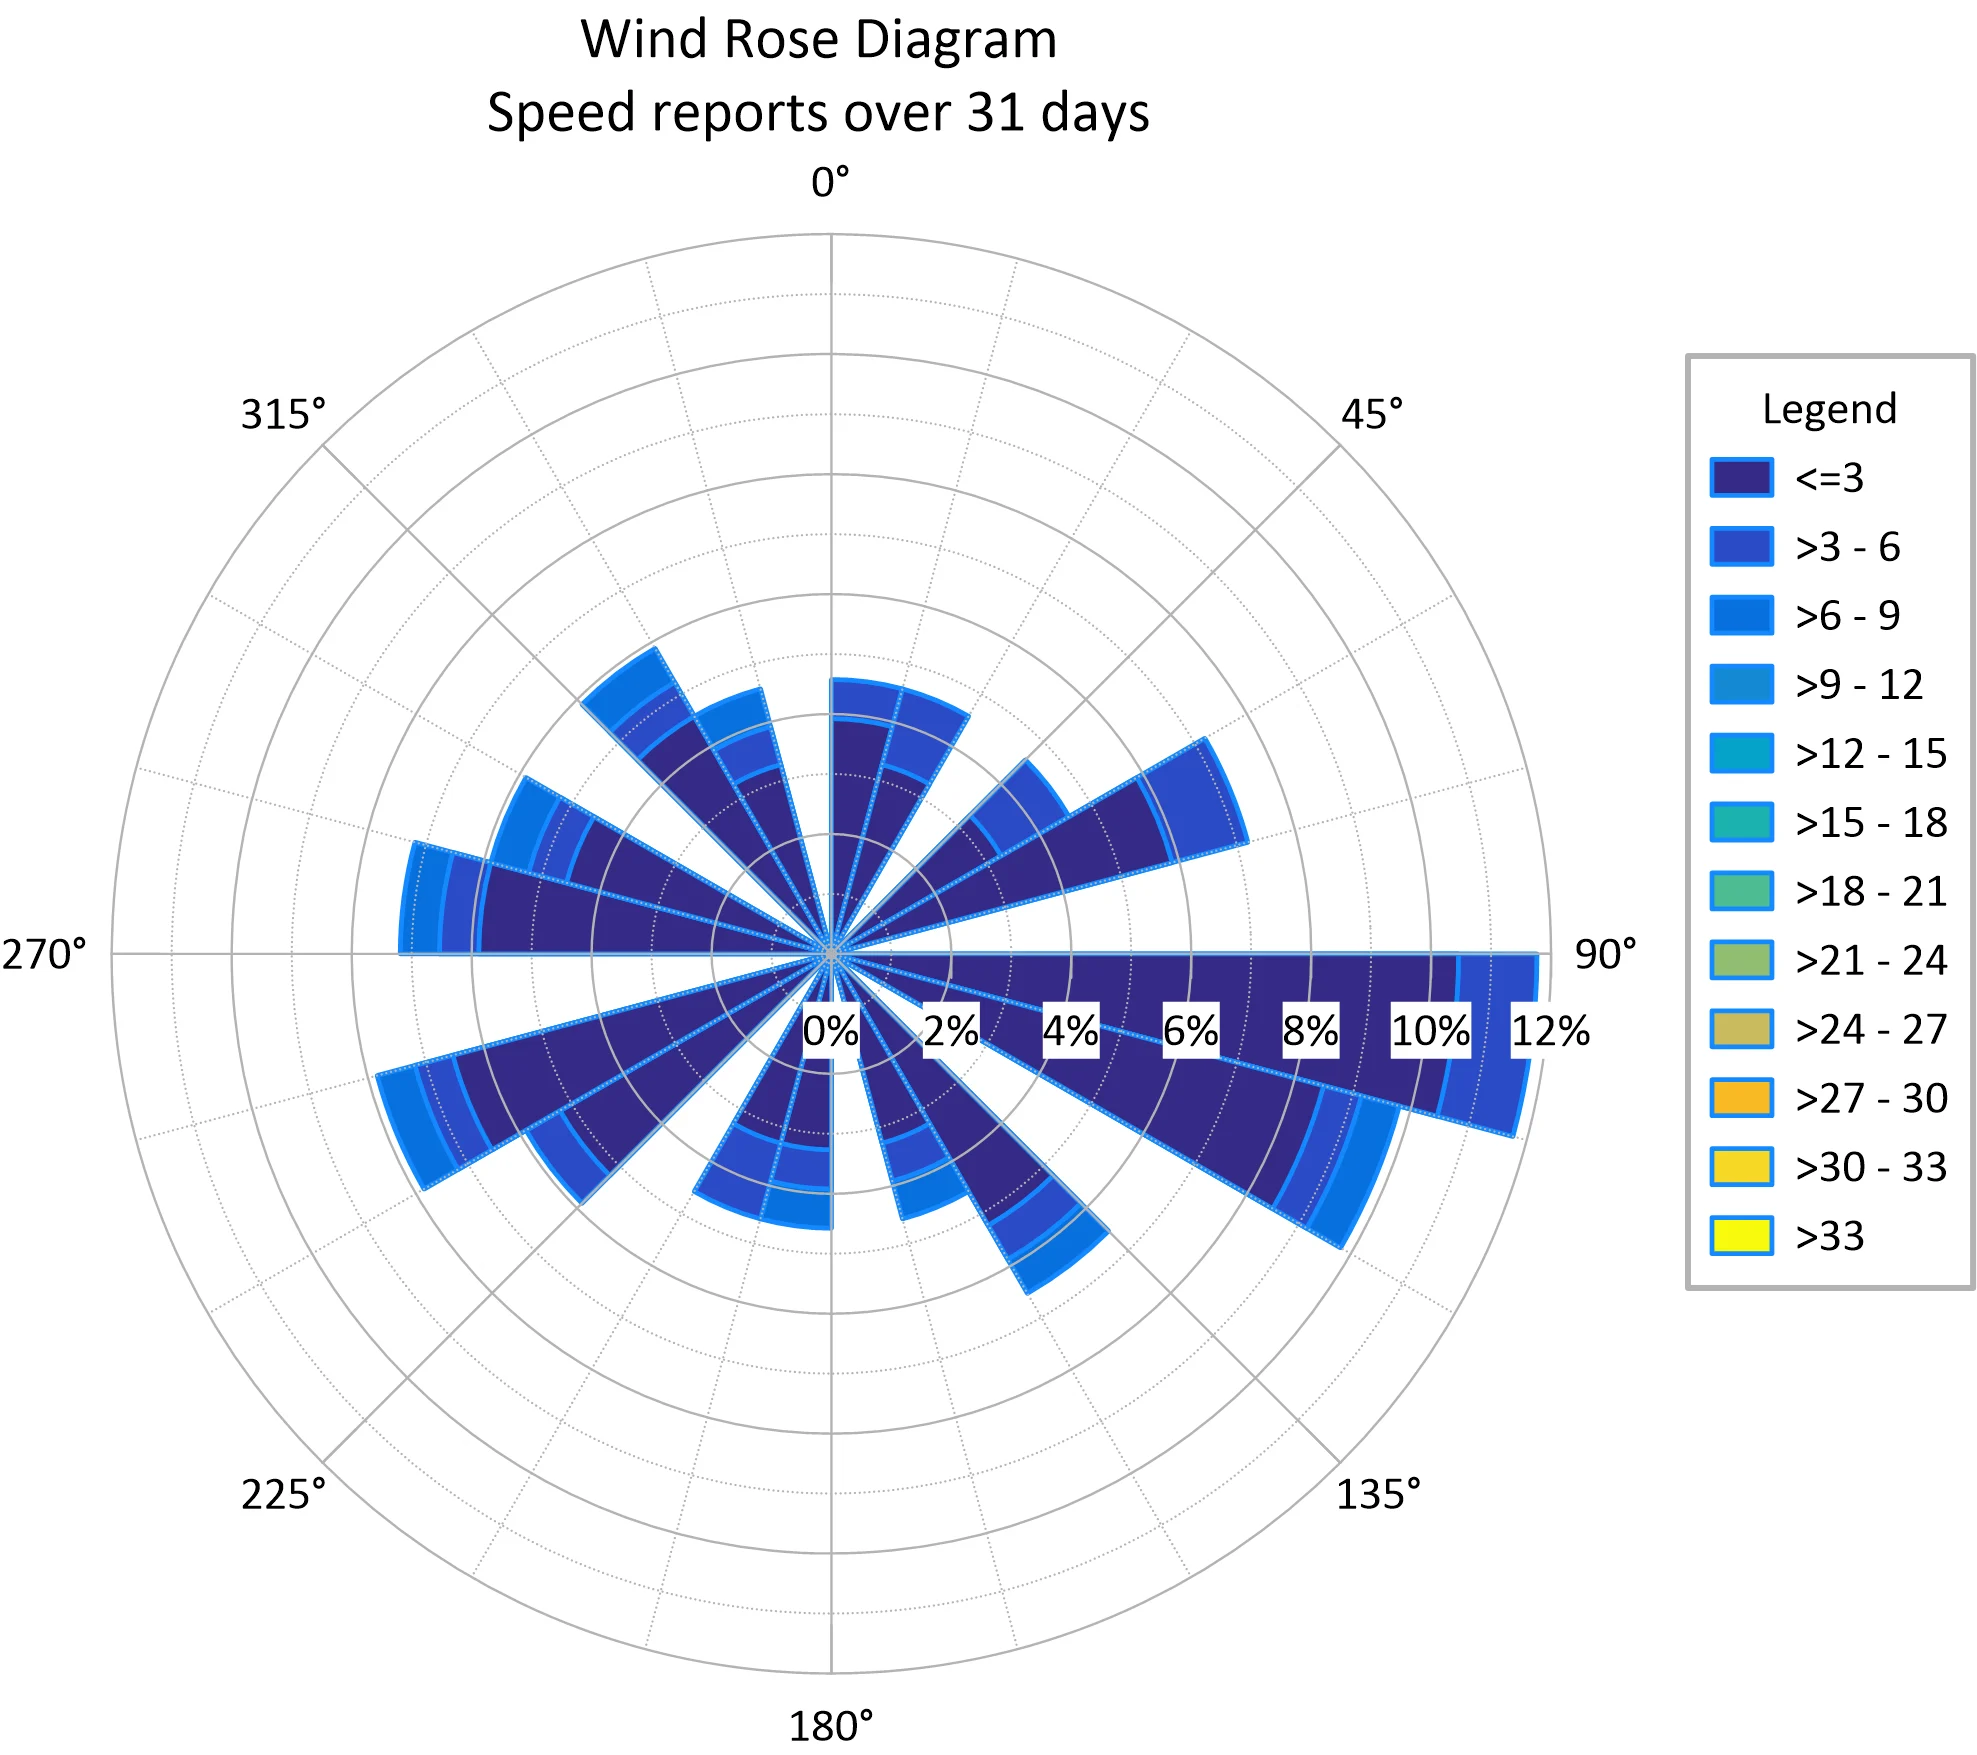
A Wind Chart, or Wind Rose Diagram, displaying wind speed and direction data over a period of time, arranged in a polar chart format with a color-coded legend representing different wind speed ranges. This visualization is used to identify prevailing wind patterns, frequency distributions, and intensity variations. The layout includes a compass-style directional grid, labeled percentage values, and a legend for quick interpretation. Ideal for climate research, wind energy assessments, and weather monitoring.
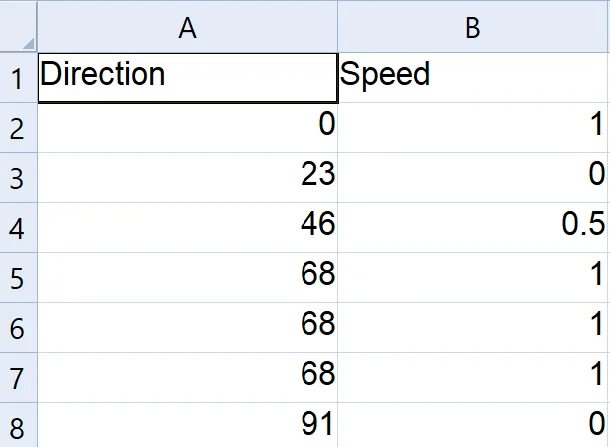
The data for this template can be found below which you can download and adjust using your own data:
Industry Focus: Construction, Environmental Science, Meteorology, Mining, Renewable Energy
Graph Features: Polar, Rose, Wind
Instructions
To use this template in Grapher:
- For the best experience, structure your data in the same format shown on this page or use the example files if provided above.
- Click Download Template at the top of this page to download a GRT template file.
- In Grapher, click File | Open and open the file.
- Click Template | Populate Template to load your own data into the template.
Primary Categories: Multidimensional
Industry Focuses: Construction, Environmental Science, Meteorology, Mining, Renewable Energy
Type: Polar, Rose, Wind