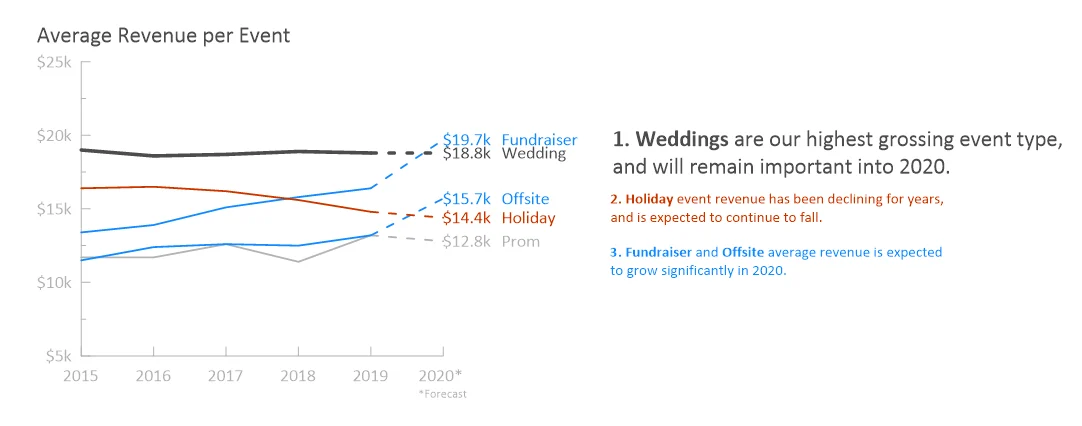
Average Revenue per Event
Grapher Template by Golden Software
143
573
Average Revenue per Event
(Template by Golden Software).grt
This graph is a strong example of storytelling with data. Its clean, uncluttered design makes it easy to understand, and the red line strategically highlights the decline in holiday revenue over time, drawing immediate attention to this trend. Clear labels and accompanying text also reinforce the main takeaway: holiday events are on a steady downturn, while categories like weddings remain stable or show growth. By blending visuals and text, this graph provides a compelling narrative that helps stakeholders see where priorities might need to shift, encouraging data-driven decision-making for the future.
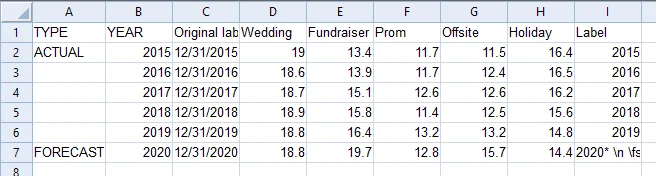
The data for this template can be found below which you can download and adjust using your own data:
Industry Focus: Business
Graph Features: Line
Instructions
To use this template in Grapher:
- For the best experience, structure your data in the same format shown on this page or use the example files if provided above.
- Click Download Template at the top of this page to download a GRT template file.
- In Grapher, click File | Open and open the file.
- Click Template | Populate Template to load your own data into the template.
Primary Categories: Comparison, Temporal, Trend
Industry Focuses: Business
Type: Line