Skip to content
Golden Gallery
Toggle Navigation
Grapher
Grapher Trial
About the Gallery
Search for:
Search Button
Search for:
Search Button
Primary Category: Trend
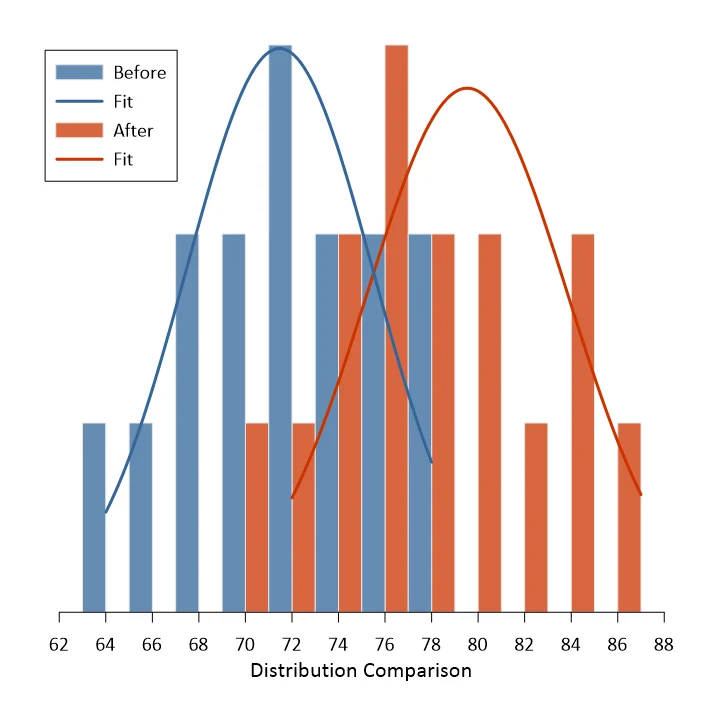
Distribution Comparison
157
532
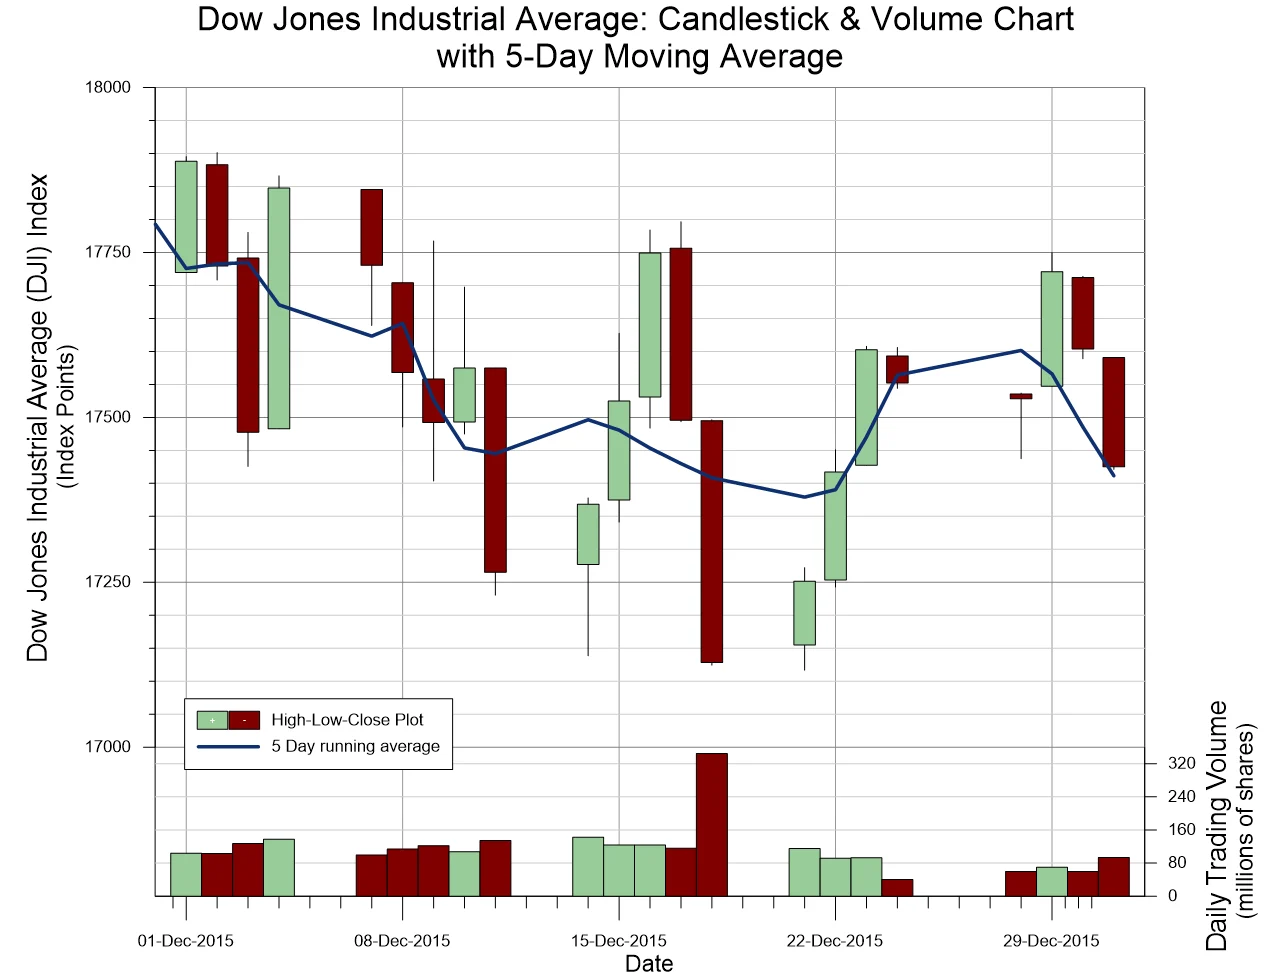
Dow Jones Industrial Average
133
530
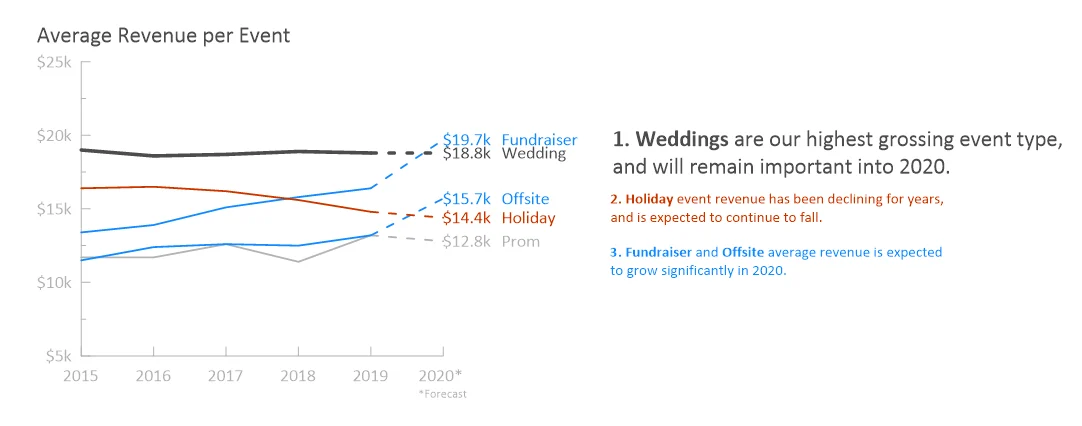
Average Revenue per Event
135
530
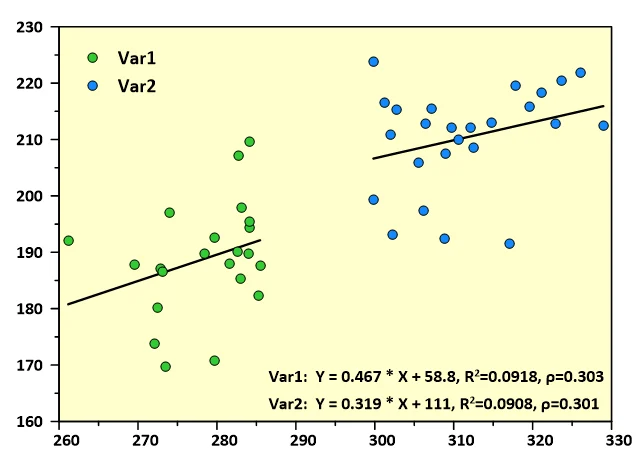
Bivariate Scatter Plot with Fits
151
529
Page load link