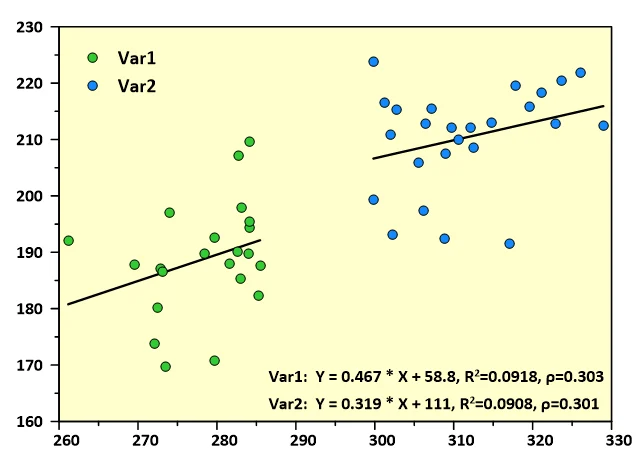
Bivariate Scatter Plot with Fits
Grapher Template by Golden Software
150
529
Bivariate Scatter Plot with Fits
(Template by Golden Software).grt
This example demonstrates how to compare two variables on a single graph, including a fitted trendline and statistics to help illustrate the relationship between them. These types of graphs can be especially useful to visualize relationships between data and even make predictions based on the regression line information.
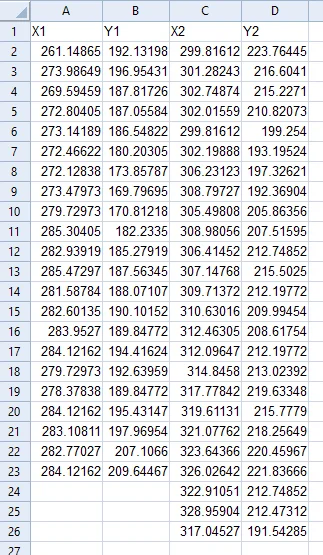
The data for this template can be found below which you can download and adjust using your own data:
Industry Focus: Education, Environmental Science, Healthcare, Manufacturing
Graph Features: Fit, Scatter
Instructions
To use this template in Grapher:
- For the best experience, structure your data in the same format shown on this page or use the example files if provided above.
- Click Download Template at the top of this page to download a GRT template file.
- In Grapher, click File | Open and open the file.
- Click Template | Populate Template to load your own data into the template.
Primary Categories: Comparison, Relational, Trend
Industry Focuses: Education, Environmental Science, Healthcare, Manufacturing
Type: Fit, Scatter