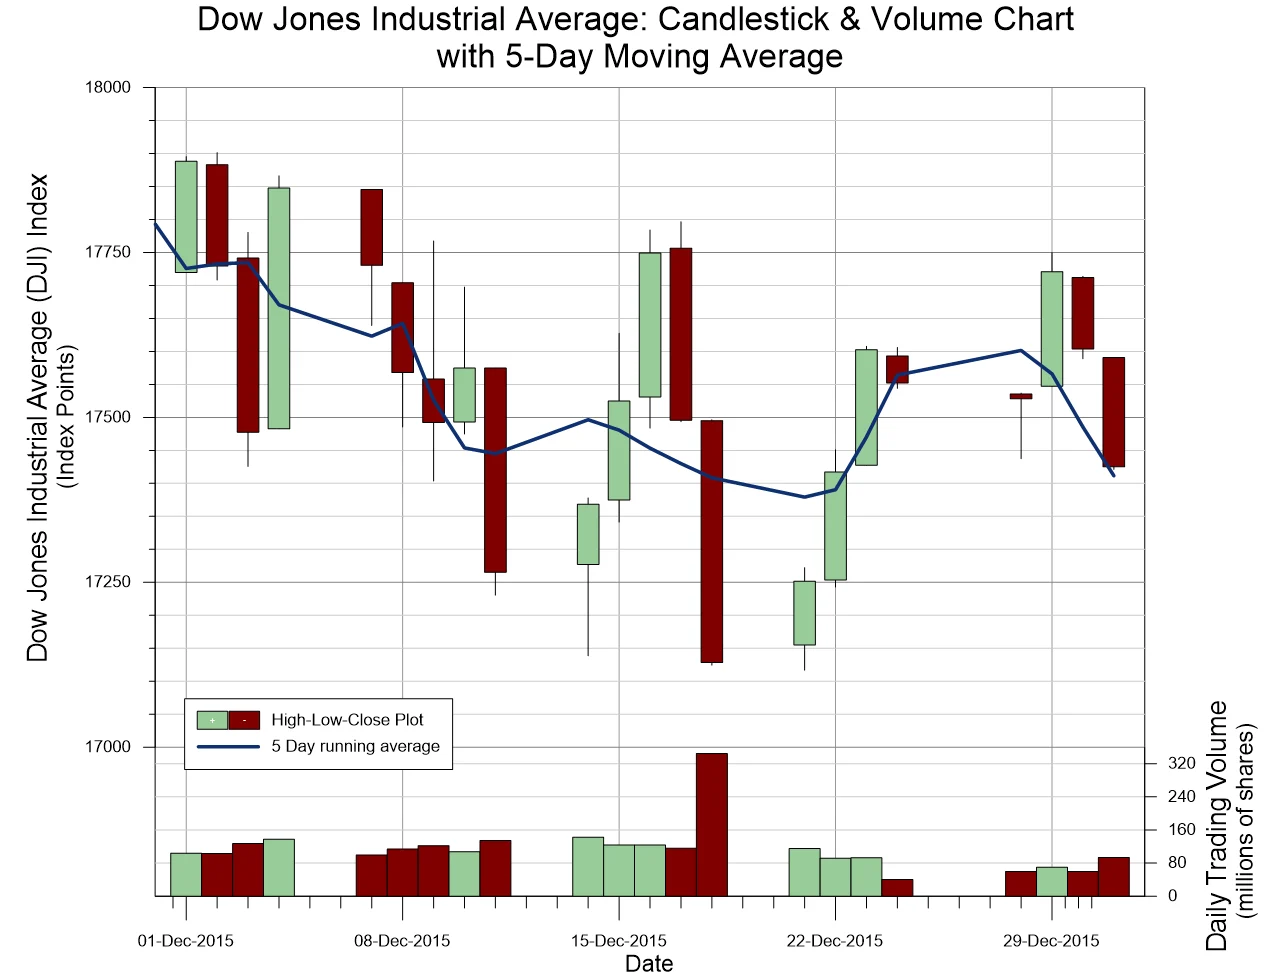
Dow Jones Industrial Average
Grapher Template by Golden Software
133
530
Dow Jones Industrial Average
(Template by Golden Software).grt
A candlestick & volume bar chart displaying financial market trends using candlestick bars to represent open, high, low, and close prices over time. The chart includes a moving average line to smooth fluctuations and a bar graph indicating daily trading volume. This visualization is used for identifying price patterns, volatility, and market trends. Common in stock market analysis, technical trading, and financial forecasting, it provides insights into market momentum, bullish and bearish trends, and support/resistance levels.
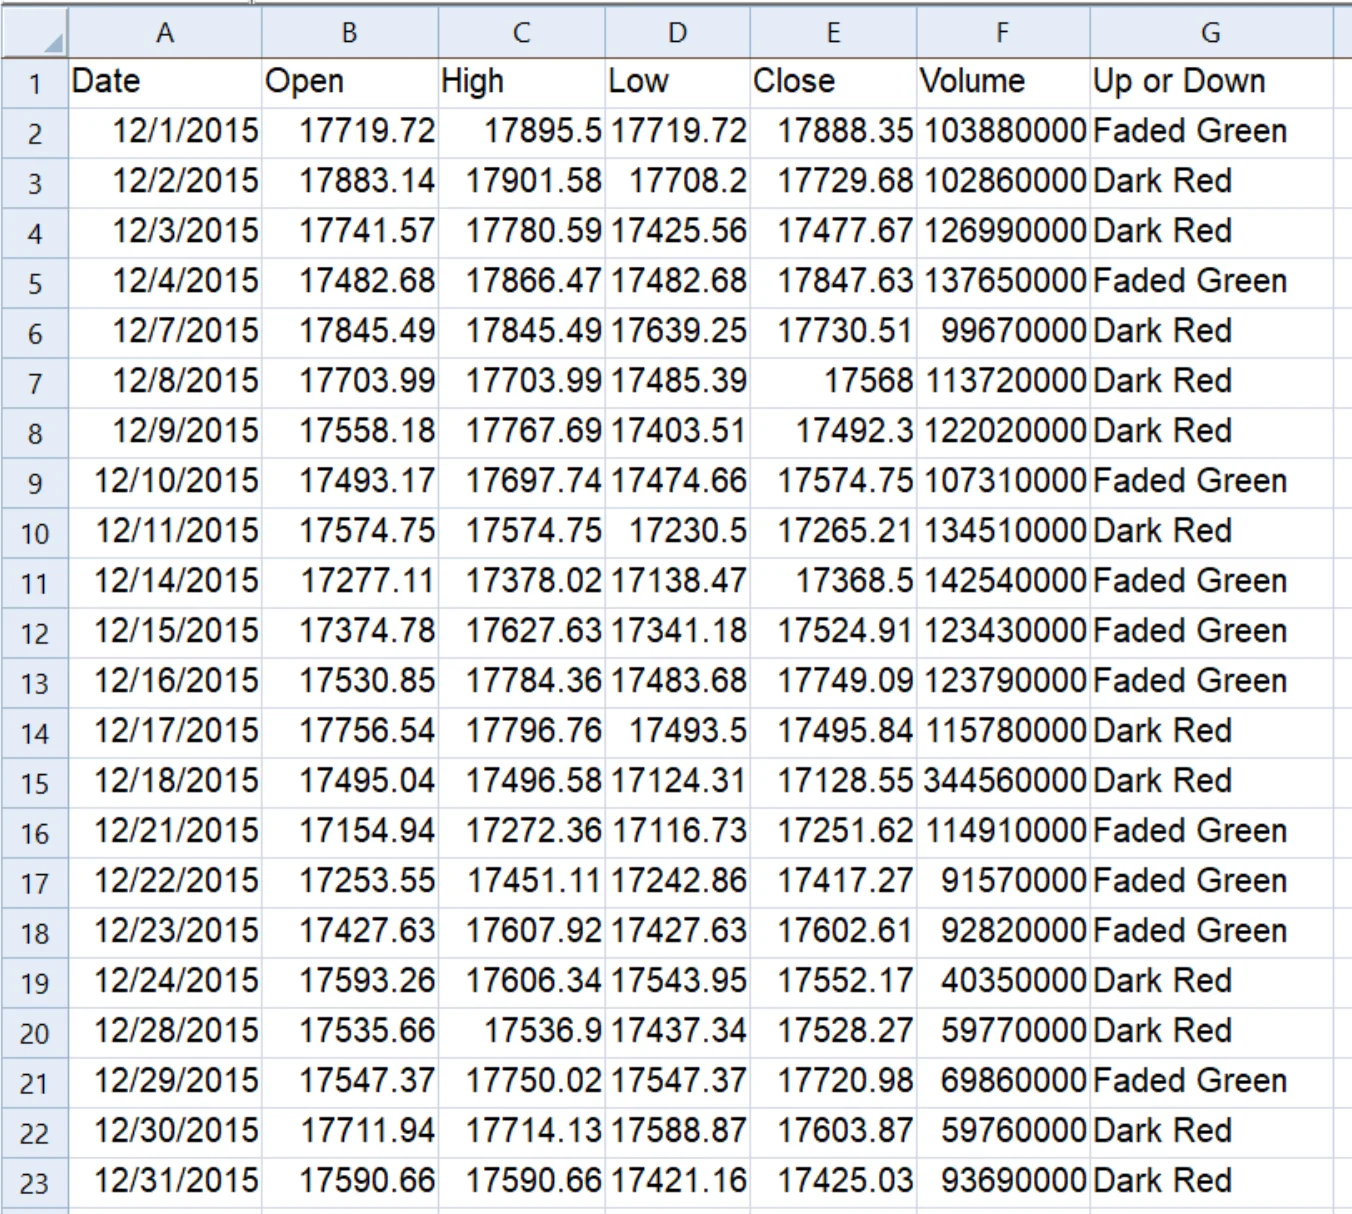
The data for this template can be found below which you can download and adjust using your own data:
Industry Focus: Asset Management, Banking, Economics, Finance, Financial Forecasting, Investment, Stock Market Analysis, Trading
Graph Features: Bar, Candlestick, Fit
Instructions
To use this template in Grapher:
- For the best experience, structure your data in the same format shown on this page or use the example files if provided above.
- Click Download Template at the top of this page to download a GRT template file.
- In Grapher, click File | Open and open the file.
- Click Template | Populate Template to load your own data into the template.
Primary Categories: Comparison, Temporal, Trend
Industry Focuses: Asset Management, Banking, Economics, Finance, Financial Forecasting, Investment, Stock Market Analysis, Trading
Type: Bar, Candlestick, Fit