Skip to content
Golden Gallery
Toggle Navigation
Grapher
Grapher Trial
About the Gallery
Search for:
Search Button
Search for:
Search Button
Primary Category: Comparison
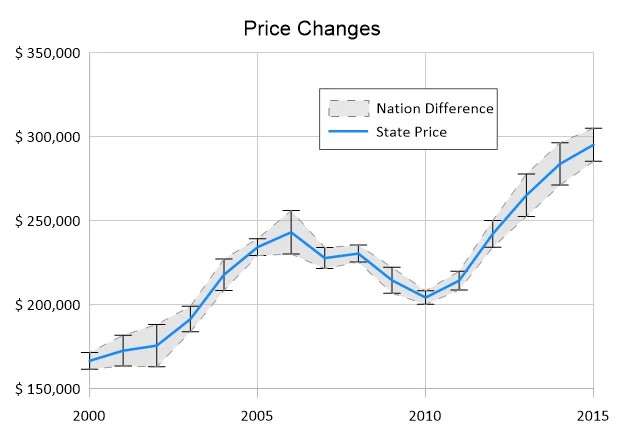
Price Changes
156
566
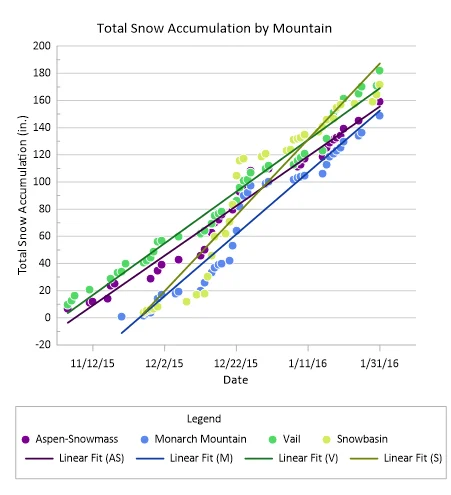
Snow Accumulation
198
564
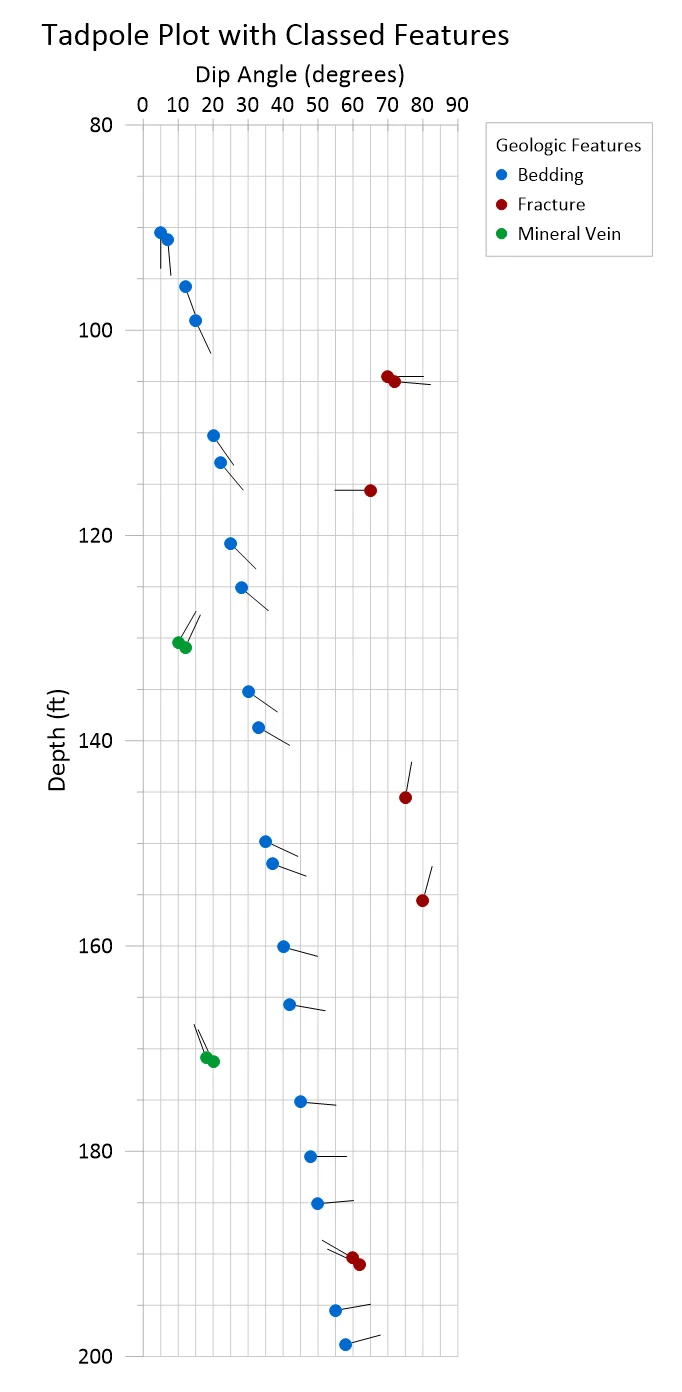
Feature Classed Tadpole Plot
205
562
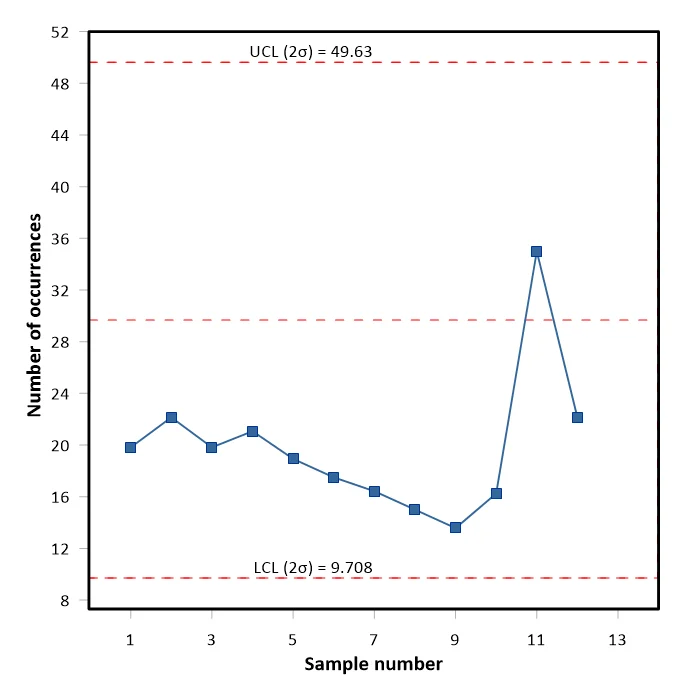
Statistical Process Control Chart
190
556
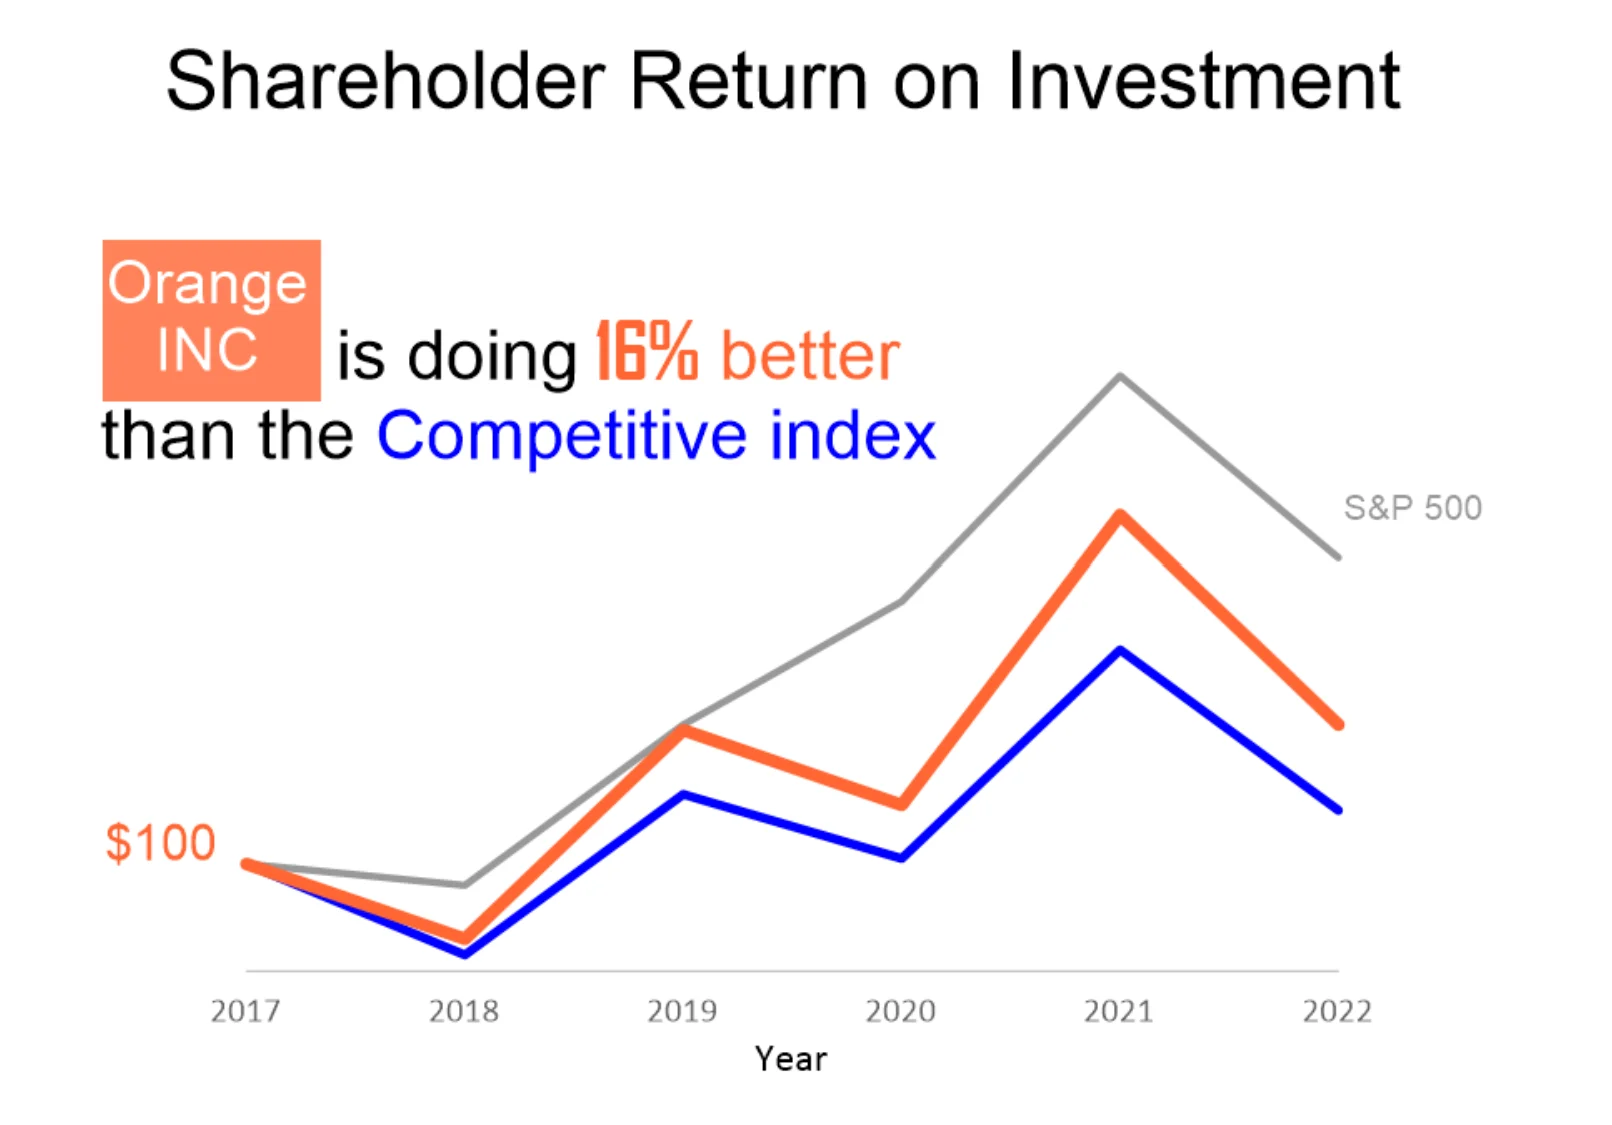
Return on Investment
154
555
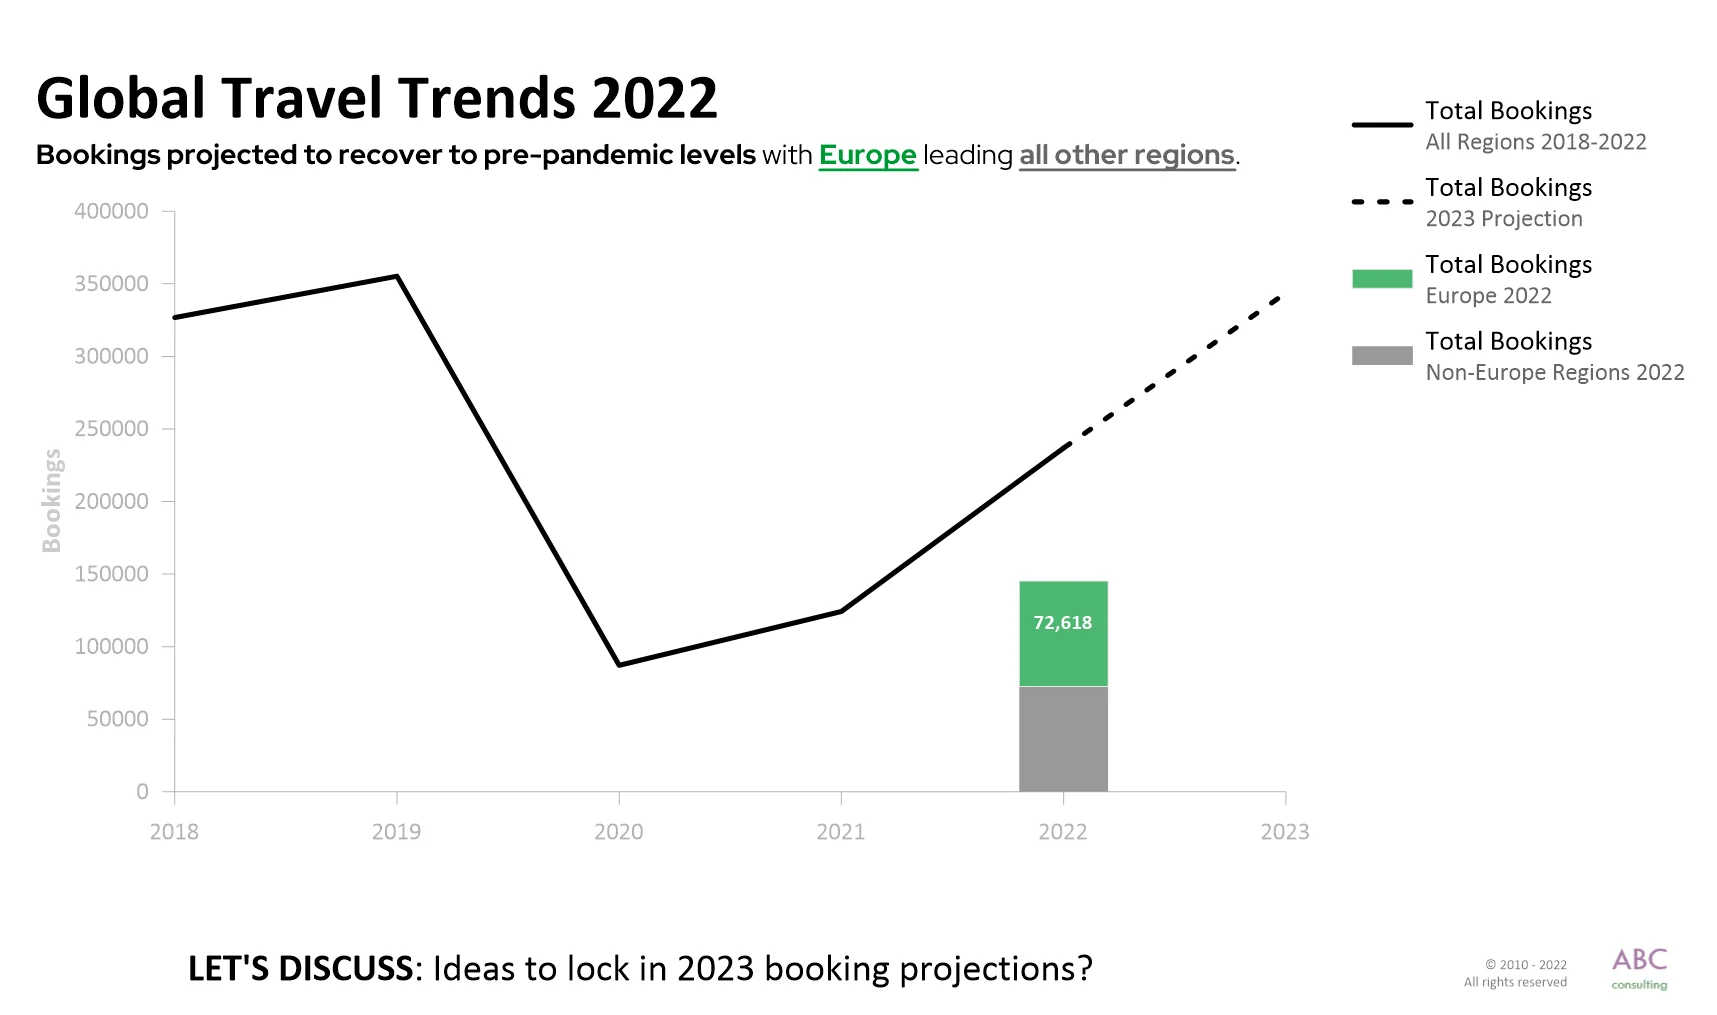
Travel Trends
145
553
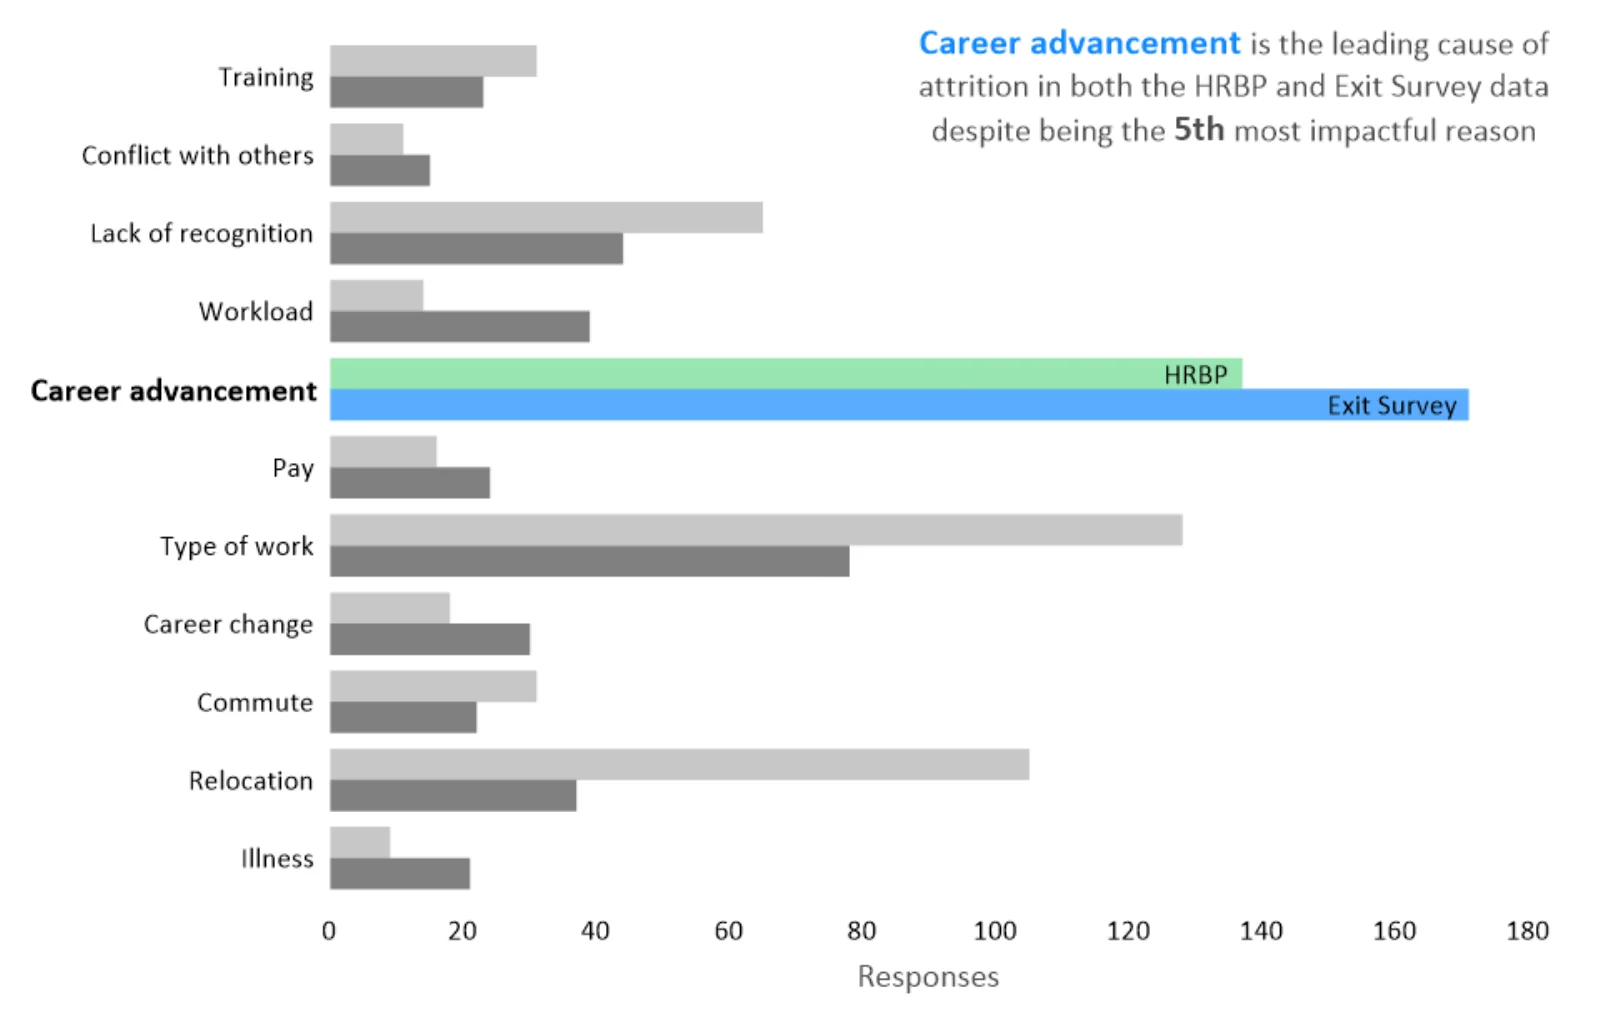
Causes of Attrition
139
551
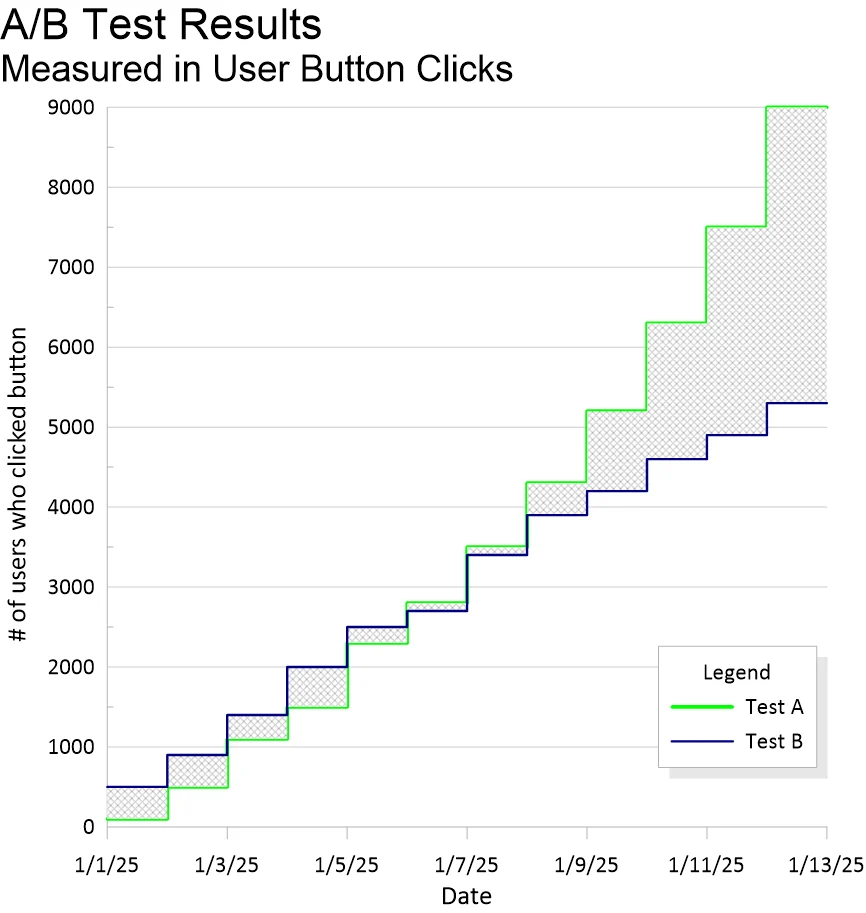
A/B Testing Results: User Clicks Over Time
124
546
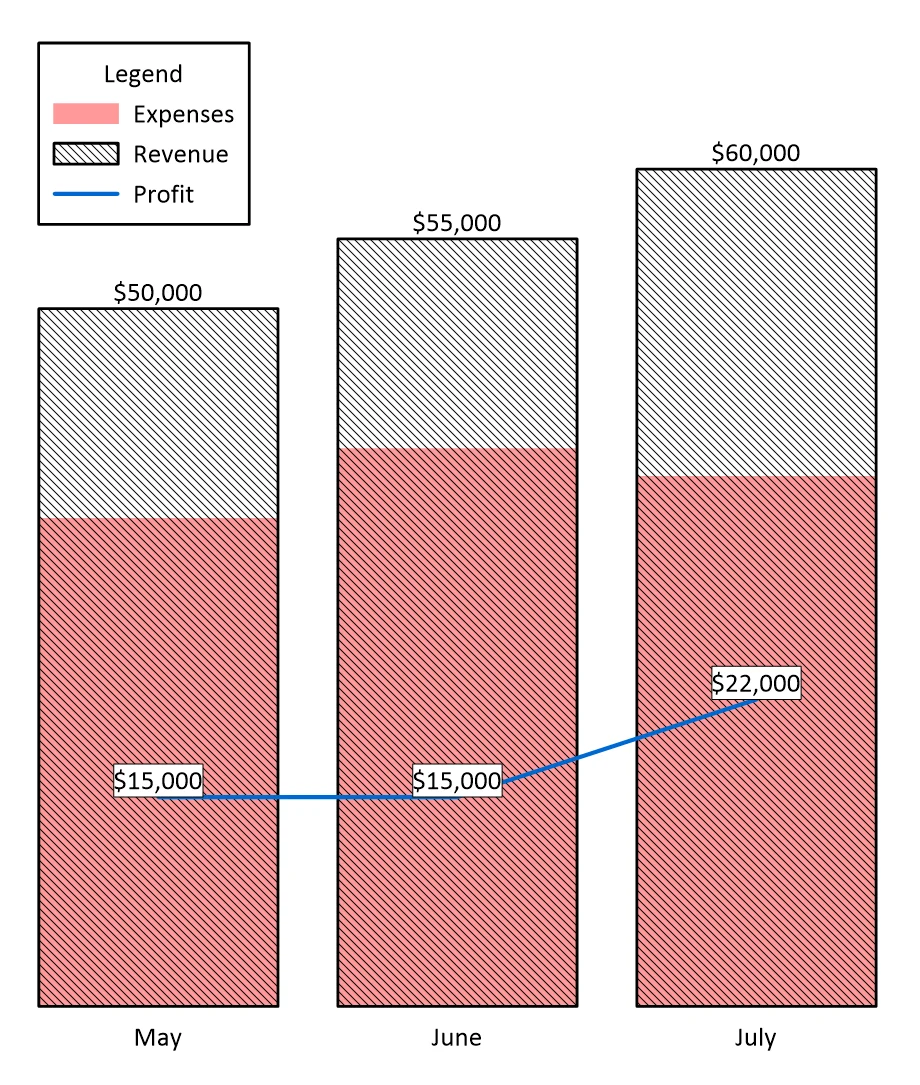
Profit Calculator
171
541
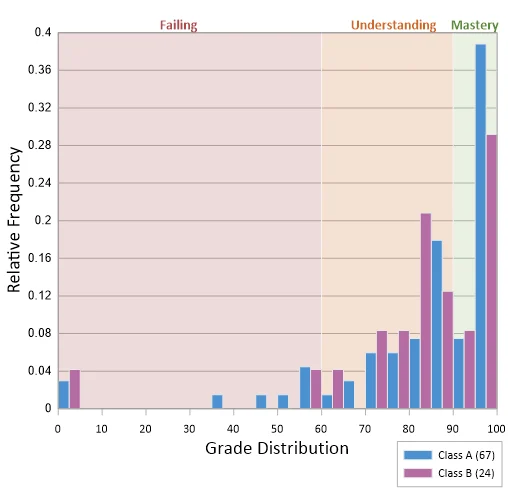
Grade Distribution Histogram
163
485
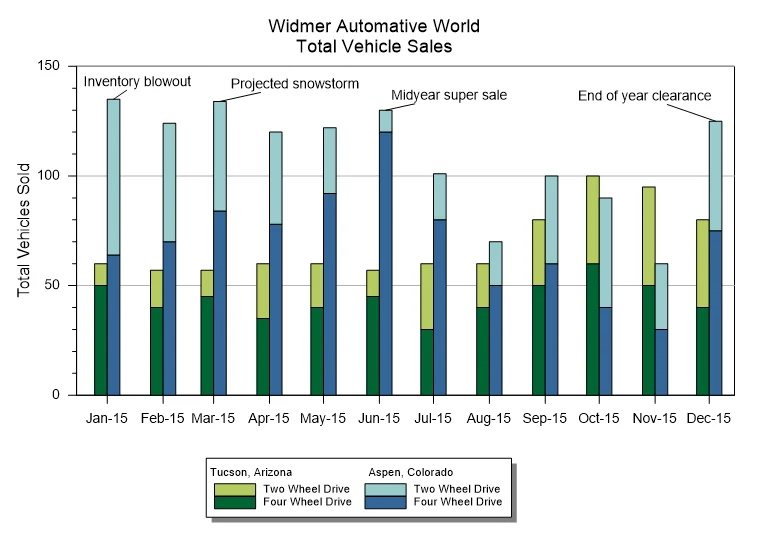
Stacked and Adjacent Bar Chart
76
179
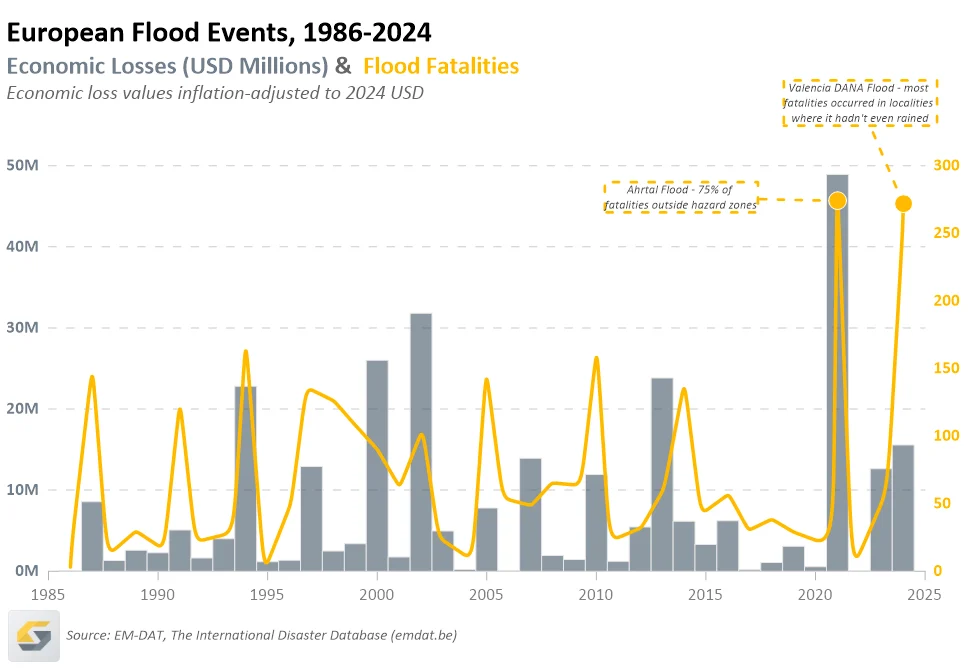
European Flood Events Time Series
29
76
Previous
1
2
Page load link